- Bloomberg – Old Wall Street Is Losing the Battle Beneath the Surface of ETFs
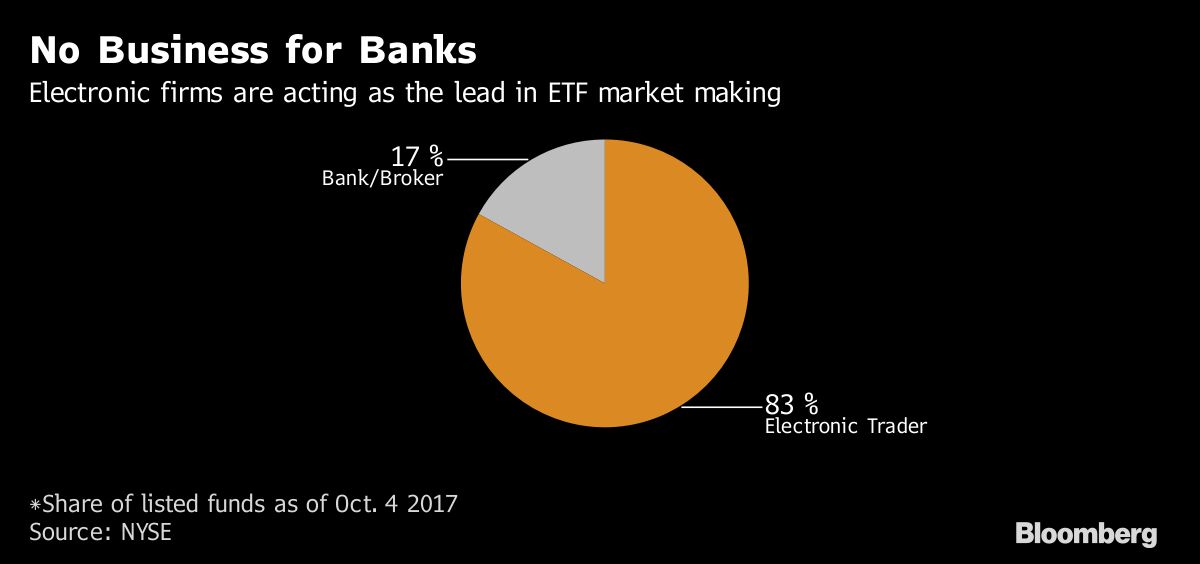
A hidden war is taking place within your exchange-traded fund, and some of the biggest names on Wall Street are losing out. Banks like Goldman Sachs Group Inc. have surrendered a once-lucrative type of market making amid an onslaught of regulation that’s wiped out profit margins. Nimbler firms — so-called high-frequency traders — have picked up the slack…Over the last few years, high-speed traders have moved from quietly trading ETFs in the shadows, to overseeing much of the market. On NYSE Arca, which hosts the majority of U.S. ETFs, 83 percent of funds have appointed an electronic firm to the key role of lead market maker, instead of a bank or conventional broker-dealer.
- The Financial Times – John Authers: How passive investors morphed into the bad guys
Index-matching funds must prepare to answer questions about their impact on marketMarkets are suffering from a serious case of passive aggression. Or at least that is what many now believe. Passive investing, in which funds merely match an index and make no active attempt to choose stocks or other securities, has transformed markets over the past 25 years. In the US, more than a third of stock funds’ assets are passive, while index funds dominate flows of new money into the market. Passive investing can be done more cheaply than active investing, which requires spending on research and salaries. This gives it an advantage. And as institutions have come to dominate trading in markets, so the markets’ judgments grow more efficient. That makes traditional “active” management ever harder — few stocks are so obviously mispriced that investors can confidently expect them to beat the index. As more and more investors work this out, so passive investing has boomed.
Comment
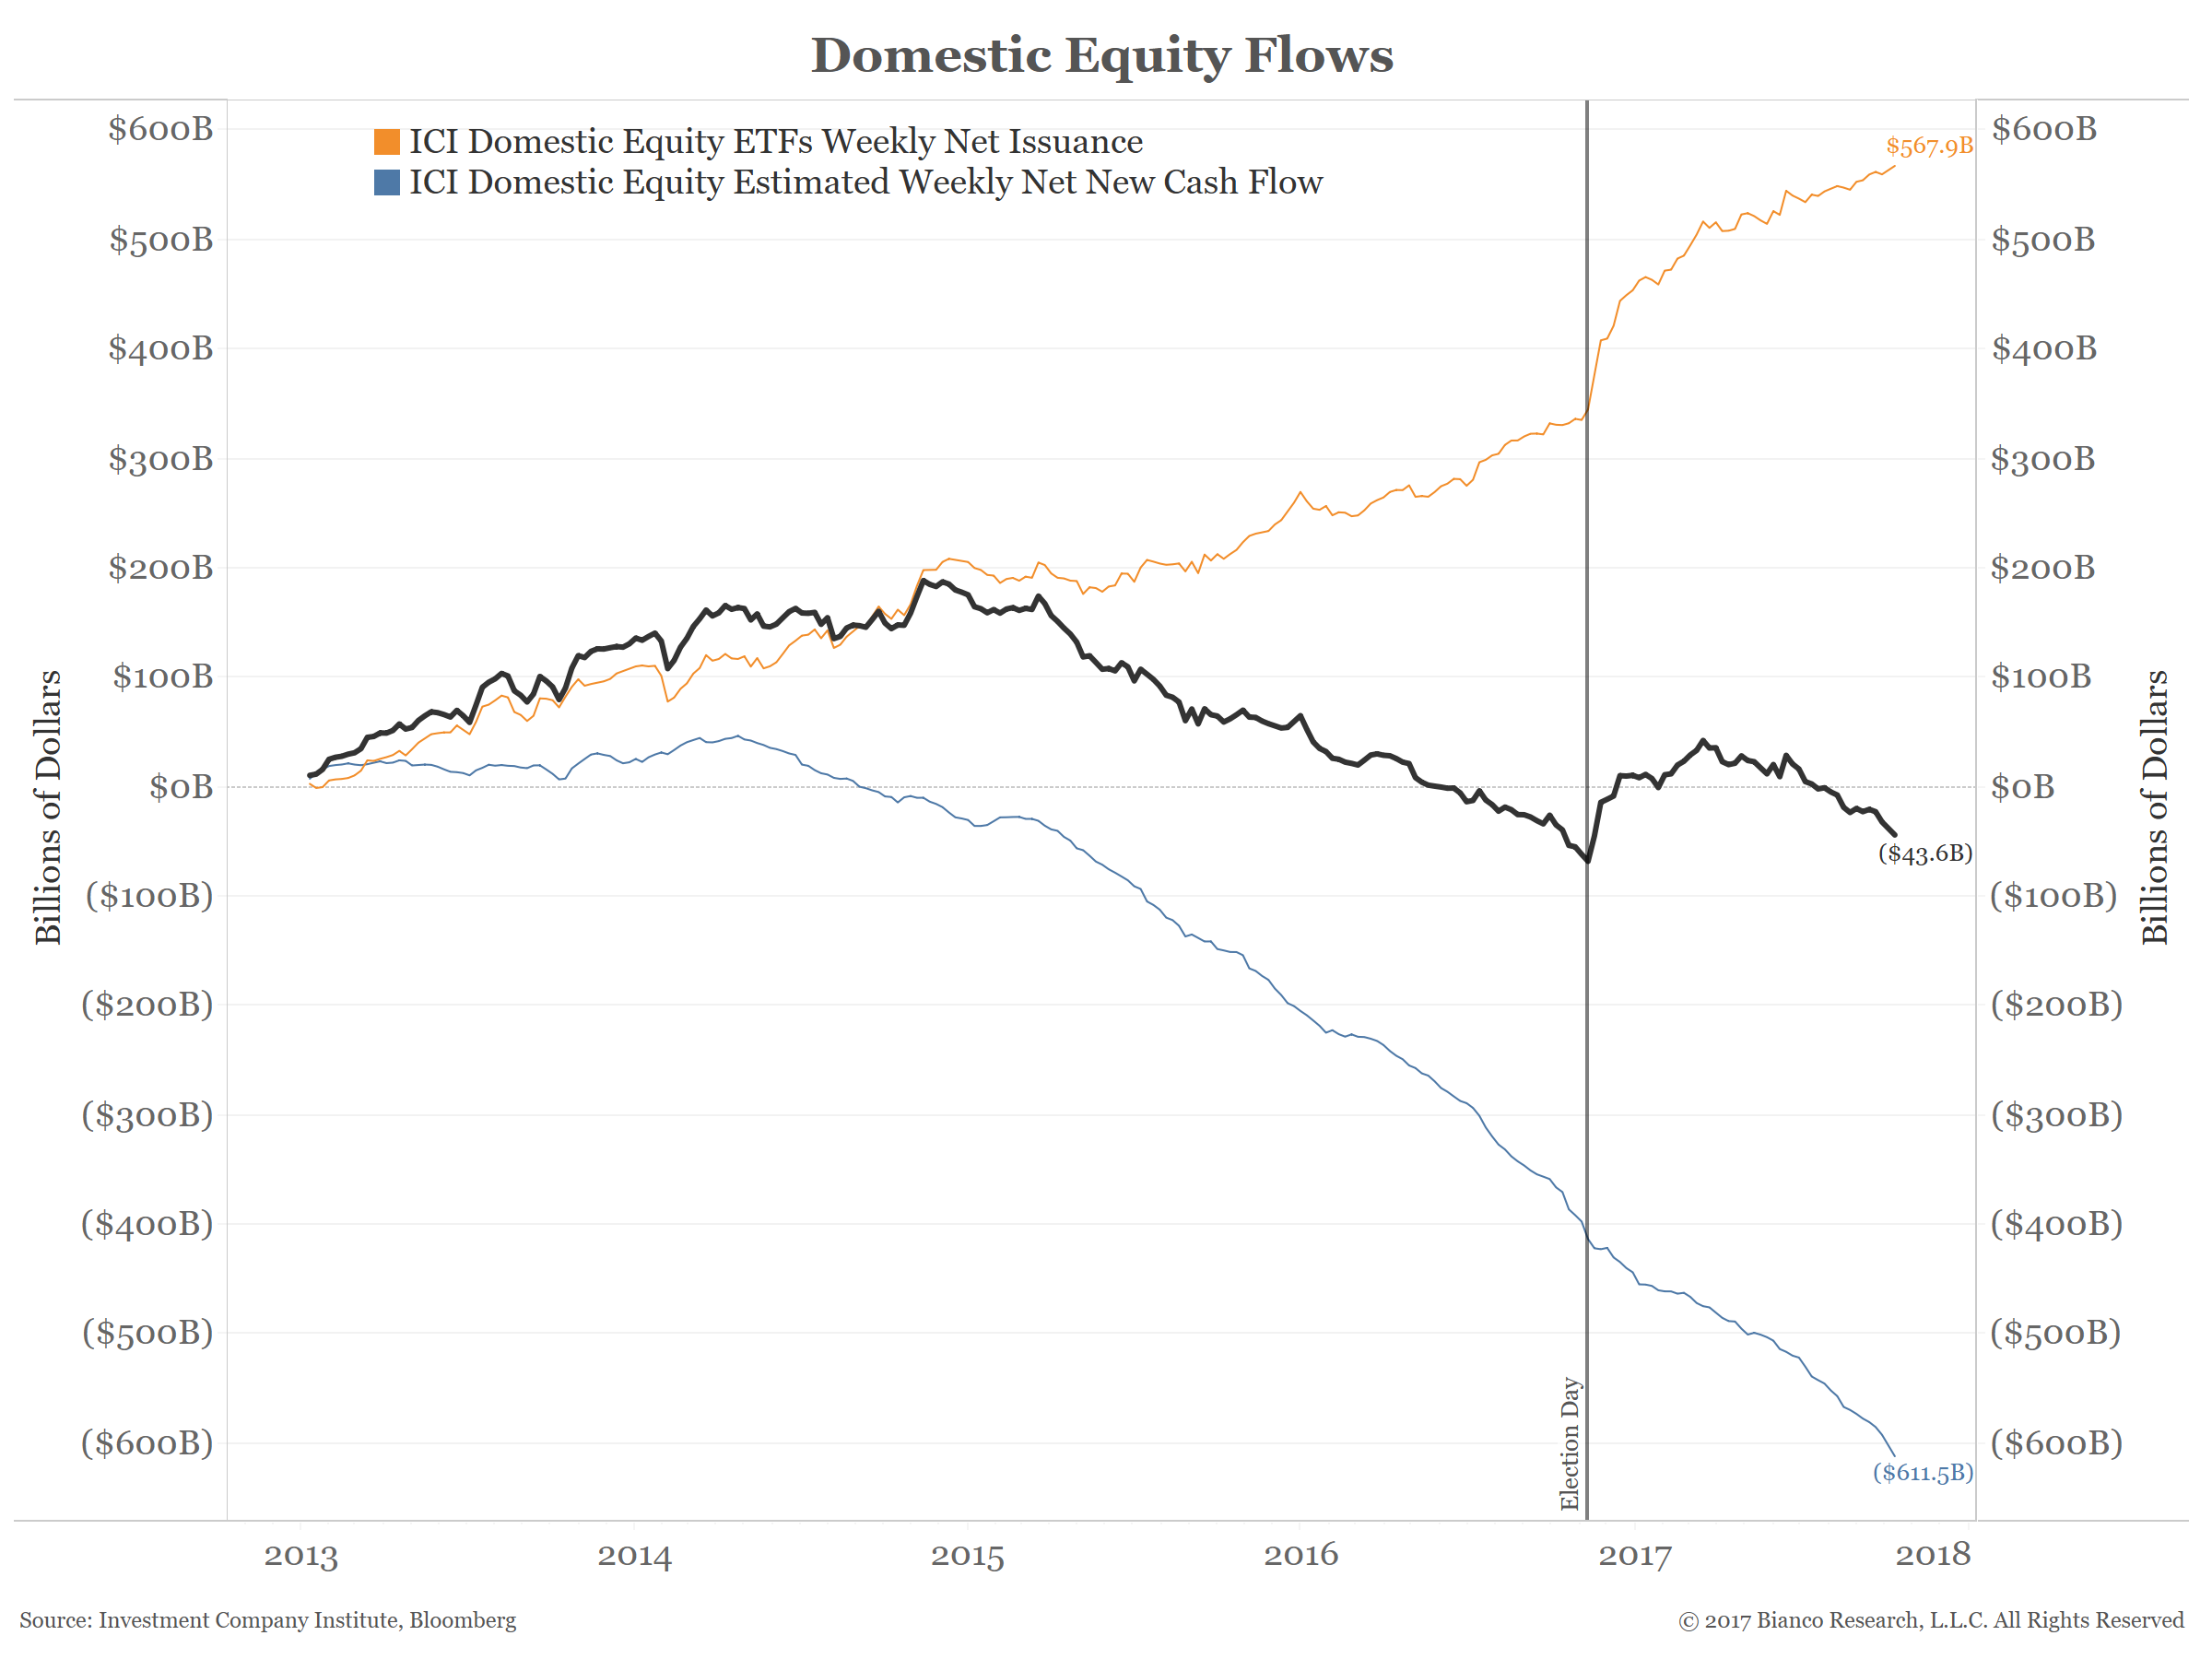
The chart below shows the preference investors have in domestic equities:
We have argued that active equity fund managers must be experiencing nothing short of an existential crisis. Why do they exist and what purpose do they serve?