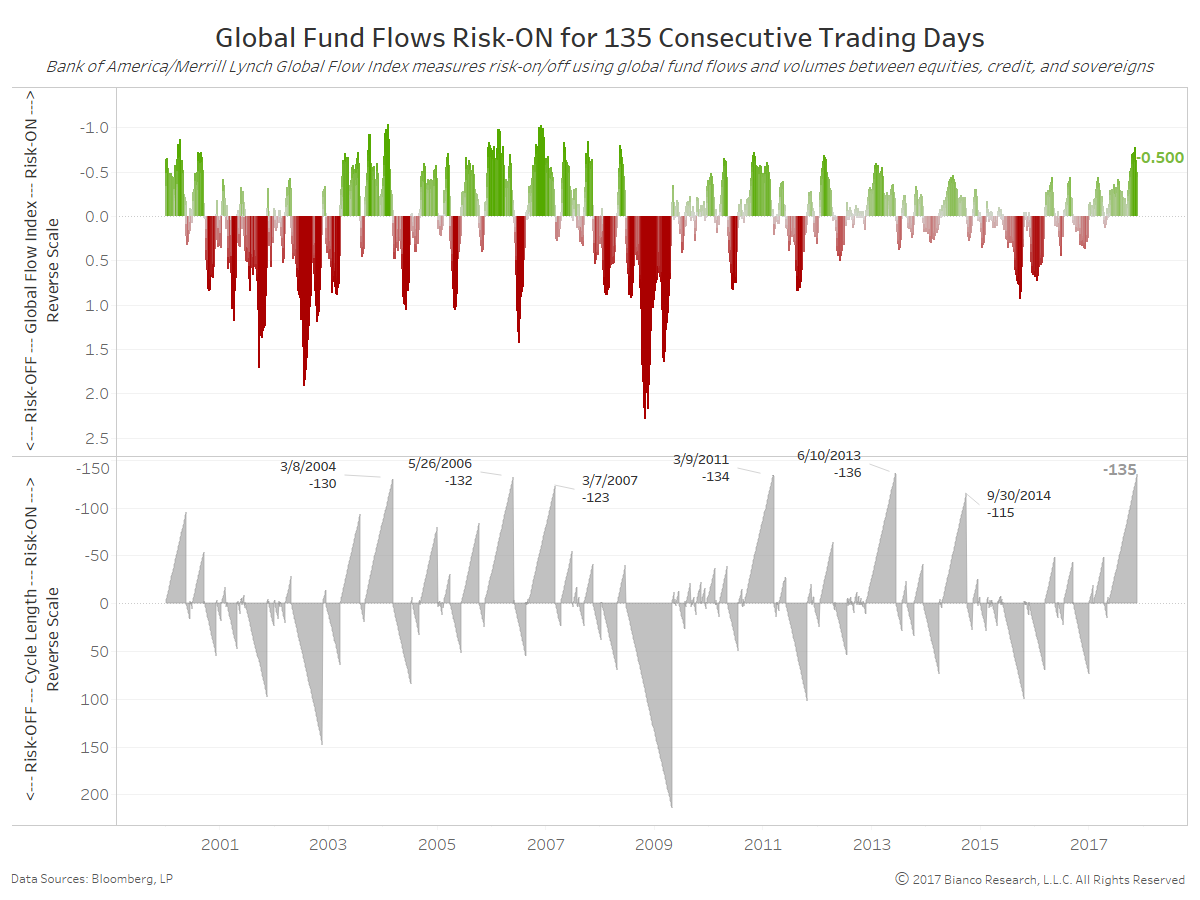
The current risk-on cycle has lasted 135 consecutive trading days, one day short of the all-time record. Barring a stock market crash, it will tie the record Friday and set a new record Monday.
The chart below measures risk-on/off cycles using BofA’s Global Flow Index, which reveals investor flows between risk and safe assets. As BofA states:
The Flow indicator is a measure of investor sentiment for equities, bonds and money markets, calculated using investor flows (data from EPFR) and volumes. Levels greater/less than 0 indicate more/less stress than is normal.
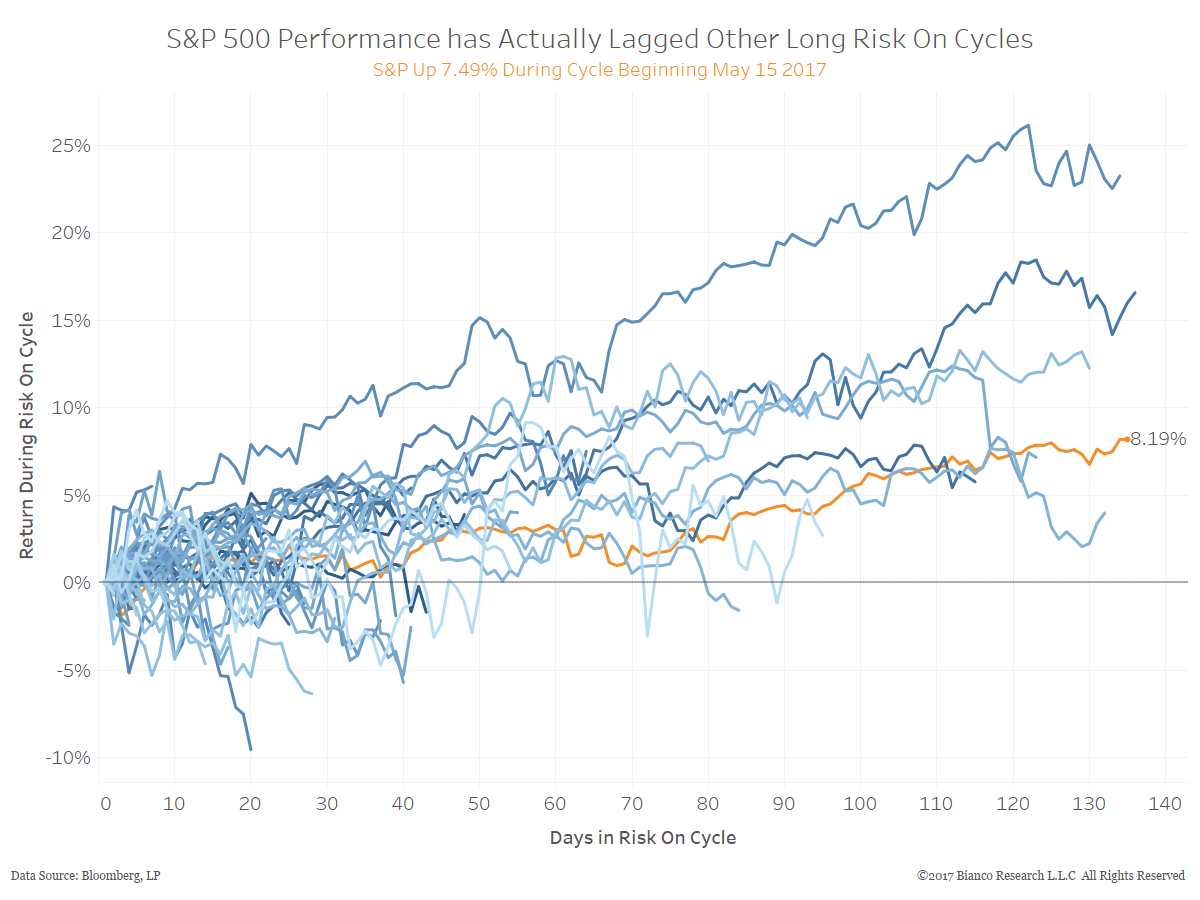
The next chart shows the performance of the S&P 500 during all risk-on cycles since 2000. For a risk-on phase that has persisted this long, the S&P 500 is actually lagging compared to prior 100+day risk-on moves. The S&P 500 is +8.19% since 05/15/17 (orange line).
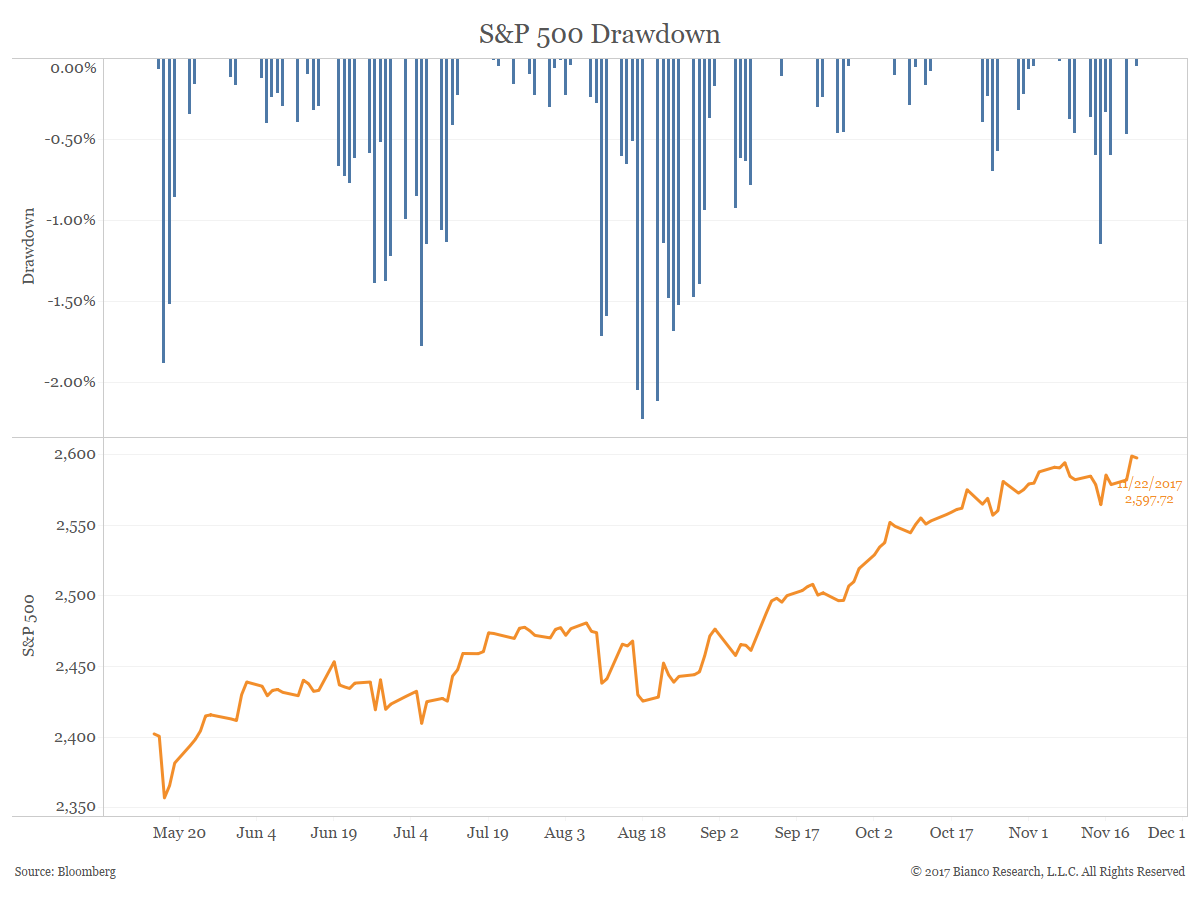
While returns have lagged those of other long cycles, this cycle has been accompanied by record low volatility. As the next chart shows, since this risk-on cycle started on May 15, the S&P has only corrected more than 2% once, in mid-August.


