Summary
Comment
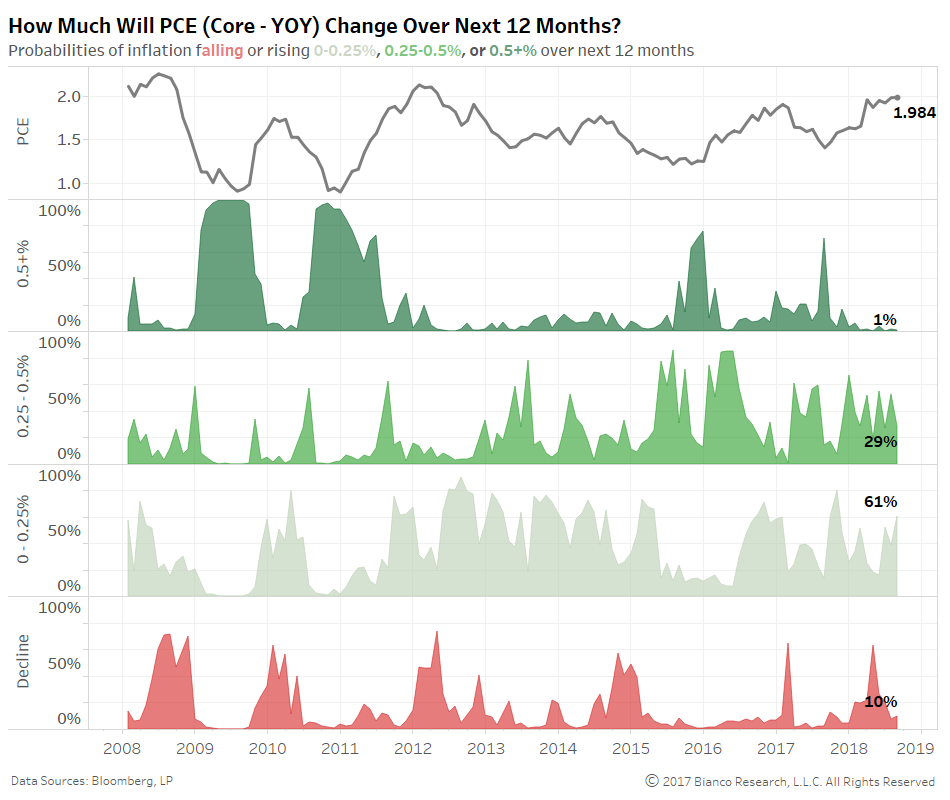
We are updating our core PCE outlook with the majority of August economic data now released, including this morning’s retail sales miss (ex auto and gas 0.2% versus 0.4% est). Major economic and survey indicators are pulled together to produce probabilities core inflation will either rise 0.5+%, 0.25-0.5%, 0-0.25%, or decline over the ensuing 12 months. In other words, we are using the historical recipes known to generate inflation to produce a near-term outlook.
Core inflation is heavily expected to see a modest increase of 0-25 bps over the next year while only a meager 30% probability of rising in excess of 25+ bps. U.S. economic growth is quite good, but not akin to past periods of swiftly rising inflation or wages. A gradual rise in core inflation plays in the Fed’s hope for a gradual rise in rates.
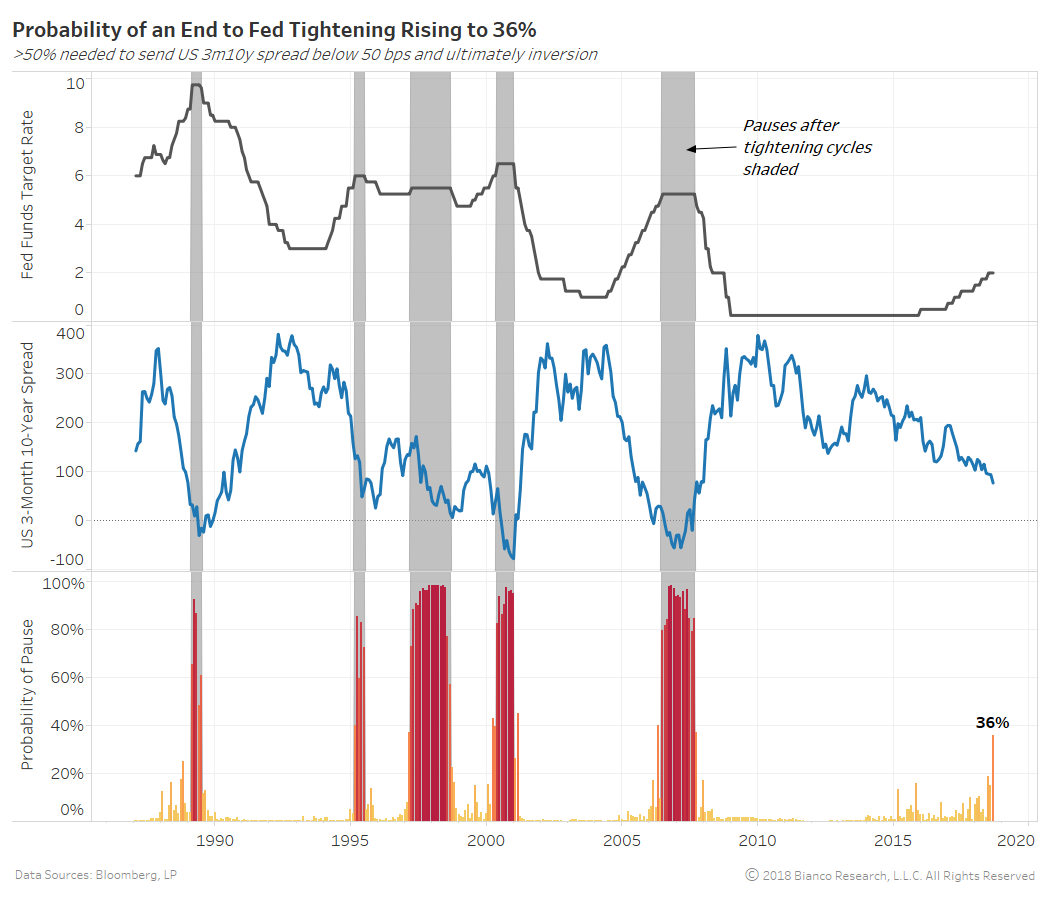
We employ this same data set to generate probabilities the Federal Reserve will finally pause from its tightening cycle. The chart below shows the fed funds target rate in the top panel, U.S. 3-month 10-year spread in the middle panel, and the probabilities of a pause in the bottom panel. Shaded areas mark past periods of pause.
The probability of Powell pausing has risen to 36% given softening inflation (PPI and CPI) and retail sales. But, we need a probability above 50% to become concerned. Stay tuned for further updates.
The Fed’s Bullard fears the widening divergence between Fed projections and inflation expectations offered by markets is reason enough to pause. For now, he remains in the minority as centrists like Brainard are donning hawk talons. Even doves like Charles Evans indicate “we are more or less singing the same tune” with the “U.S. economy is firing on all cylinders.”
We use the Federal Reserve’s own words from official communications including speeches, minutes, and testimonies to estimate the number of rate hikes expected over 12-month periods. The red line in the chart below indicates the number of rate hikes synonymous with Federal Reserve rhetoric from 1996 through 2007. The blue line provides market-based expectations (Morgan Stanley based calculation) for rate hikes over the next 12-months.
Brainard’s latest speech, What Do We Mean by Neutral and What Role Does It Play in Monetary Policy?, pushed the Fed’s expectations to a full five hikes for the next twelve months. Markets are not keeping pace with an increasingly hawkish Federal Reserve, pricing half as many at 2.5 hikes.
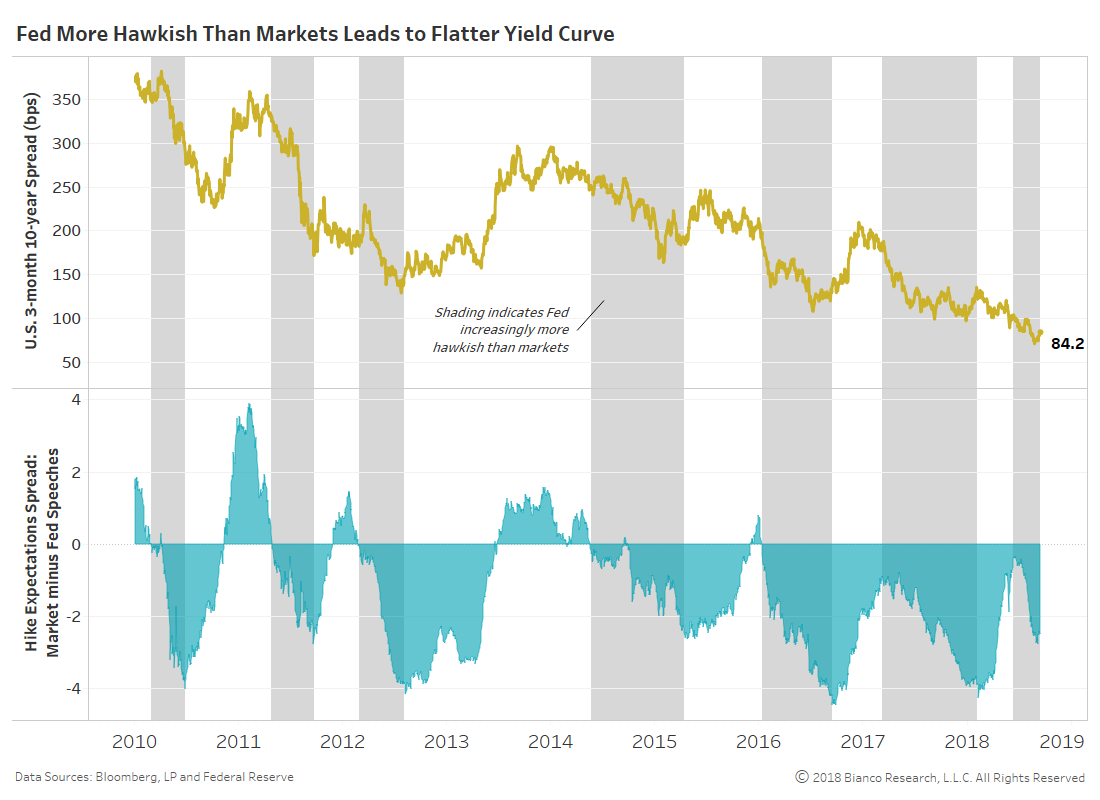
The next chart shows the U.S. 3-month 10-year spread in the top panel and the spread between market and Fed expectations for hikes in the bottom panel. We have shaded past periods when markets were quickly falling behind the Fed like the past three months.
Convergence between markets and the Fed would favor a sideways to steeper U.S. yield curve. Gaps in excess of three hikes have offered the best periods for steepening.
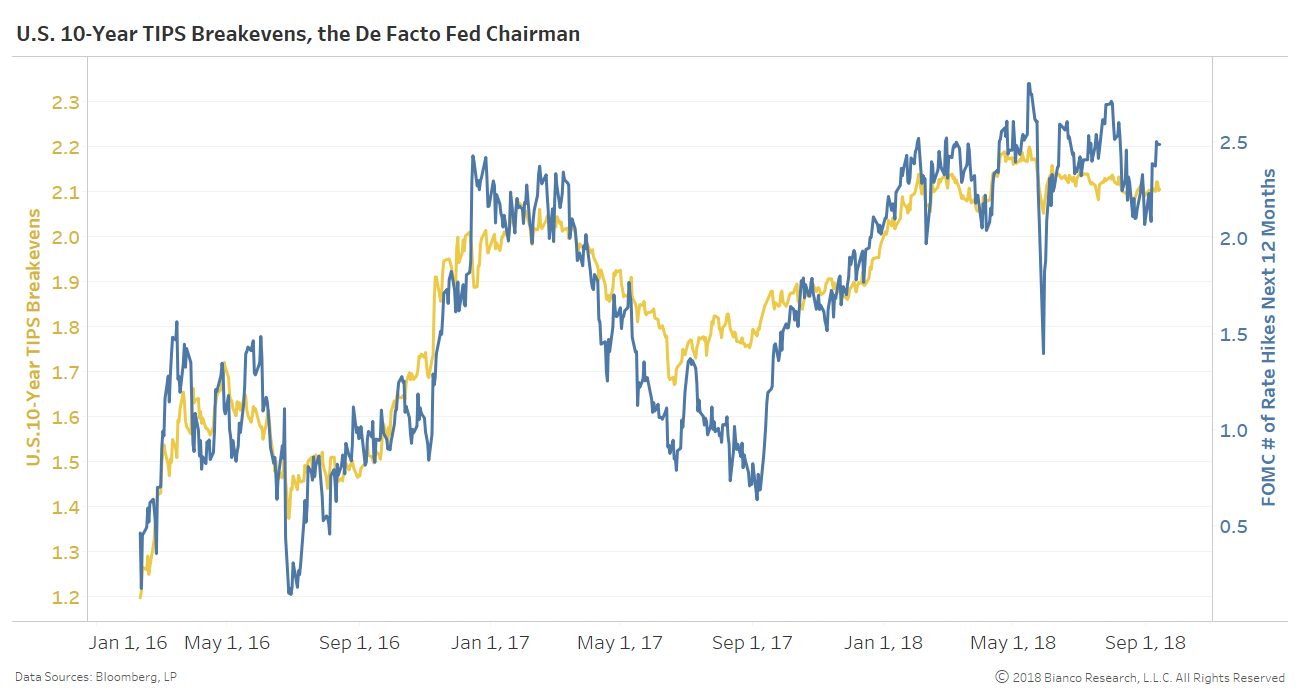
The widening or narrowing of the gap between markets and the Fed over rate hikes will come down to market-based inflation expectations, which have been stuck in the tightest trading range in history since February 2018. The correlation between U.S. 10-year TIPS breakevens (yellow) and rate hikes priced in for the next twelve months (blue) has been a very strong 84% since February 2016.
Wondering why U.S. 10-year note yields can not persist above 3.0%? Blame this ‘sleeping giant’ of anemic inflation expectations. Inflation swap caps/floors, our preferred metric, are still pricing in near 2-to-1 odds headline CPI runs BELOW 2.5% year-over-year for the next 10 years!


