Summary
Comment
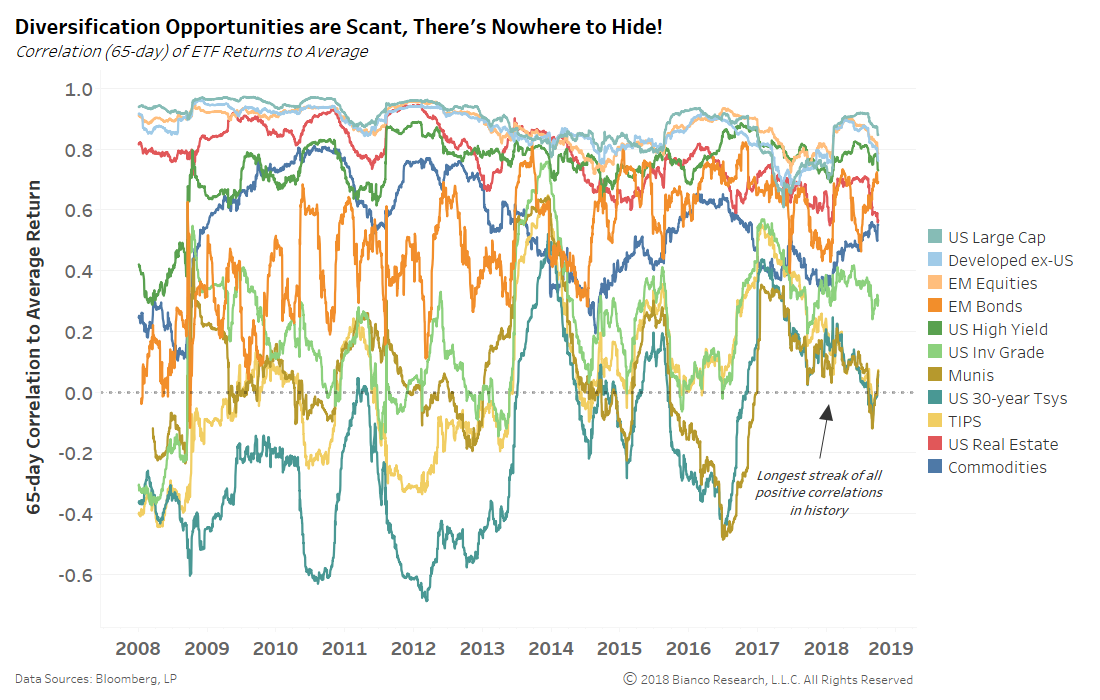
We have harped on investors facing a lack of diversification opportunities since late 2016. The chart below shows the rolling three-month correlation of major ETF returns to a portfolio average. Not a single asset class offered a negative correlation throughout 2017 into August 2018.
A brief period of negative correlation to the portfolio average by U.S. Treasuries, inflation protection (TIPS), and municipal bonds in August and September 2018 has ended.
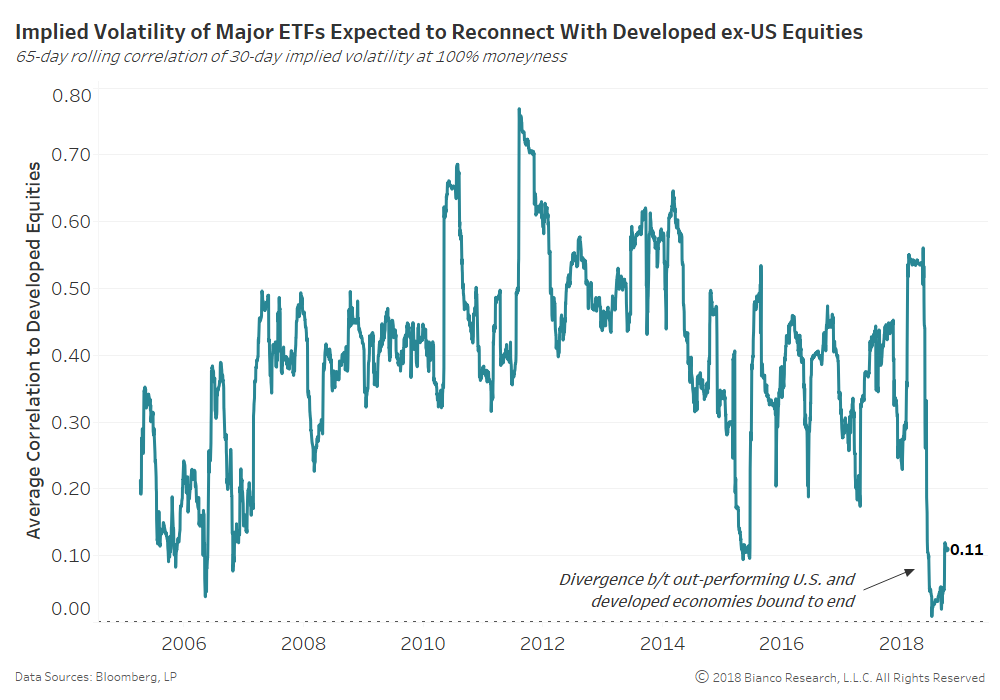
The next chart shows rolling three-month correlations between implied volatility for each asset class and the TIP ETF. All asset classes from emerging markets to gold saw a swift rise in correlation to the volatility surrounding inflation expectations in February 2018.
PCE’s core reading accelerated to nearly a 2.0% year-over-year pace in March 2018, boosting inflation expectations to new heights in April 2018. But, inflation expectations have since become horrifically range-bound and core inflation itself is slowing to a pace back below the Fed’s target.
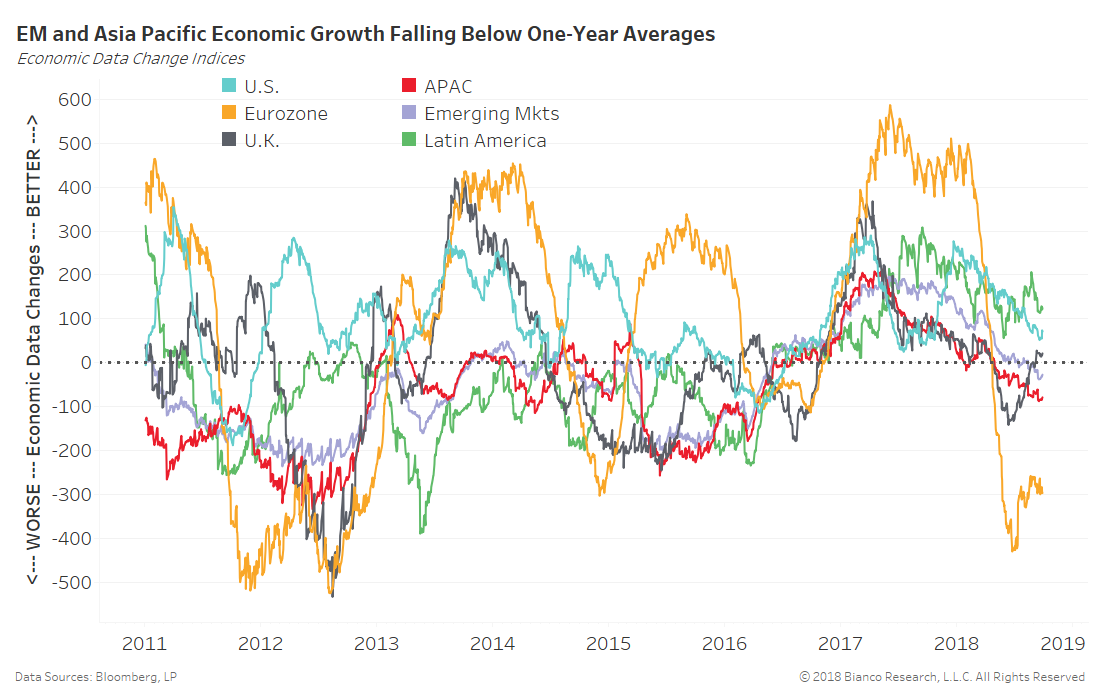
The last chart shows the Citigroup Economic Data Change indices for major regions. These indices measure the distance of incoming economic data releases to one-year average growth rates.
The Eurozone is primed to rebound on the heels of an improving United Kingdom. The U.S. and Latin America remain standouts with above-average growth persisting since early 2016. We expect all major economies to gravitate toward one-year average growth rates in the months ahead.
Therefore, economic growth out of the Eurozone, Asia Pacific, and emerging markets will be moving to front and center.
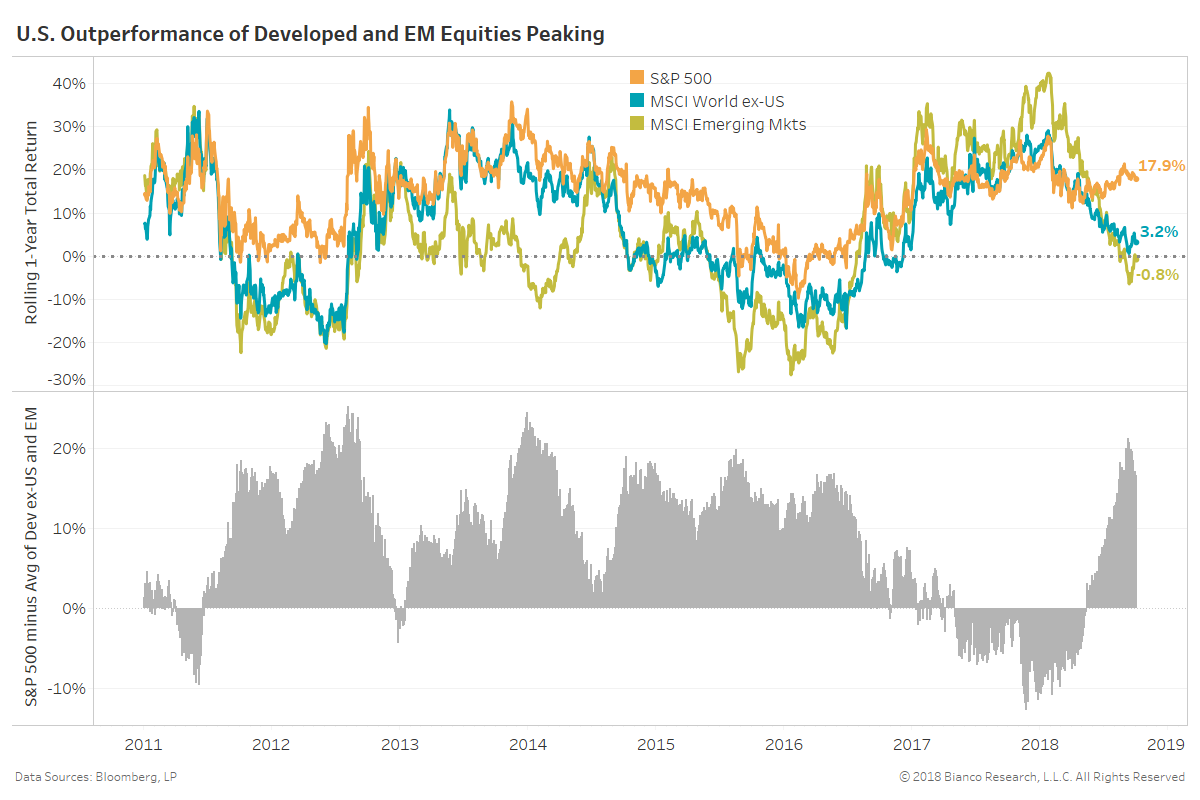
Investors’ piling into U.S. equities is likely peaking given a recent 20+% gap between the performance of the S&P 500 versus the MSCI developed ex-U.S. and emerging markets indices.
Diversification may truly be difficult to find, but a rotation back to risk assets outside U.S. borders appears likely.


