Summary
Comment
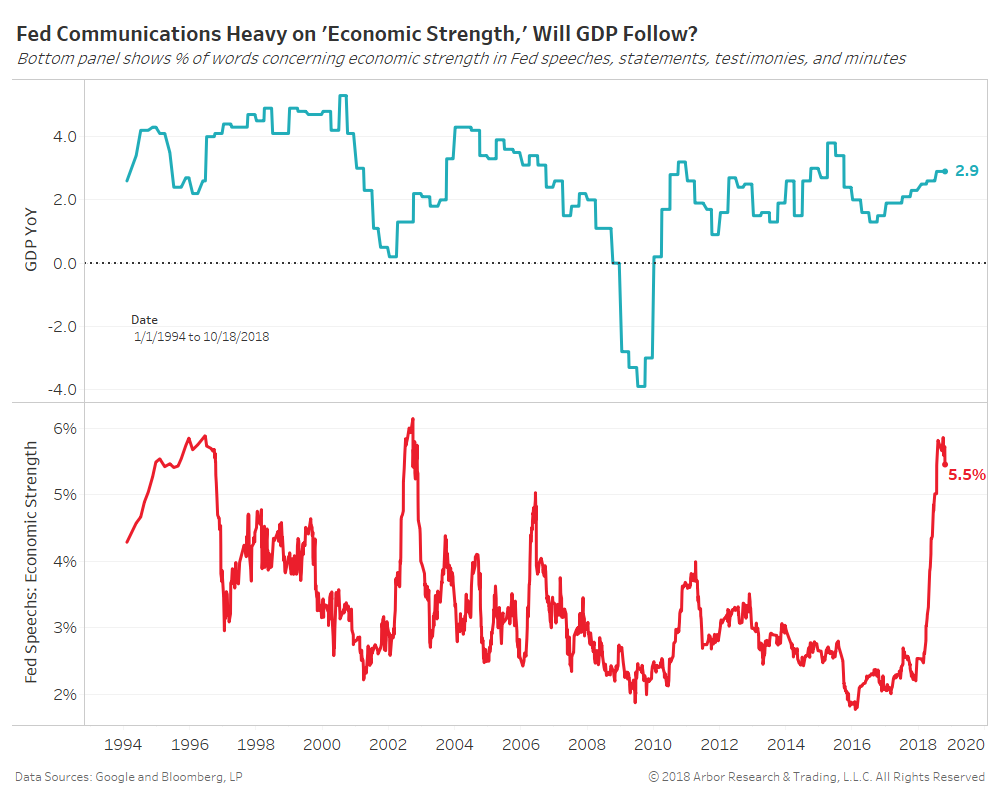
The chart below shows U.S. real GDP year-over-year in the top panel and the percentage of Federal Reserve communications including words of economic strength in the bottom panel.
Powell et al have made a transition from harping about inflation to exclaiming about a robust U.S. economy. Their rosy comments are being spoken at the greatest rate since 2002. Will GDP rise enough to meet such a bullish outlook?
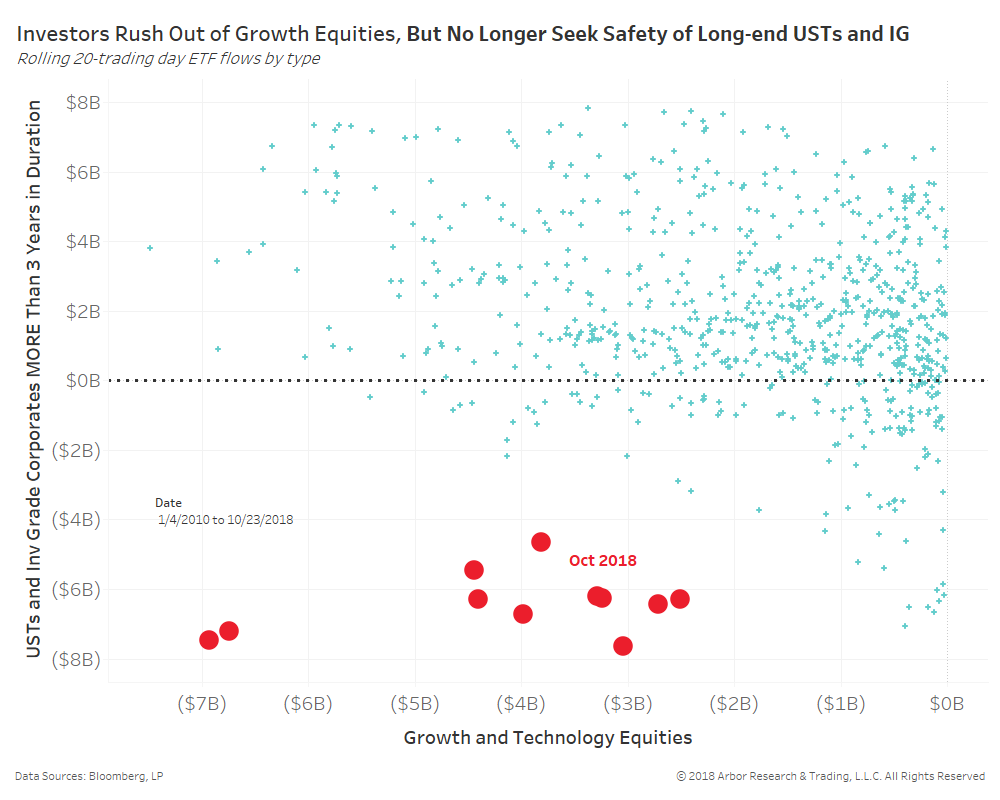
The scatterplot below shows the relationship between 20-trading day flows of growth equities and U.S. Treasuries and investment grade corporates above three years in duration.
Investors have soured on taking risk with a rush out of growth and technology ETFs. But, risk-off flows are abnormally NOT being sent into longer-end safe assets.
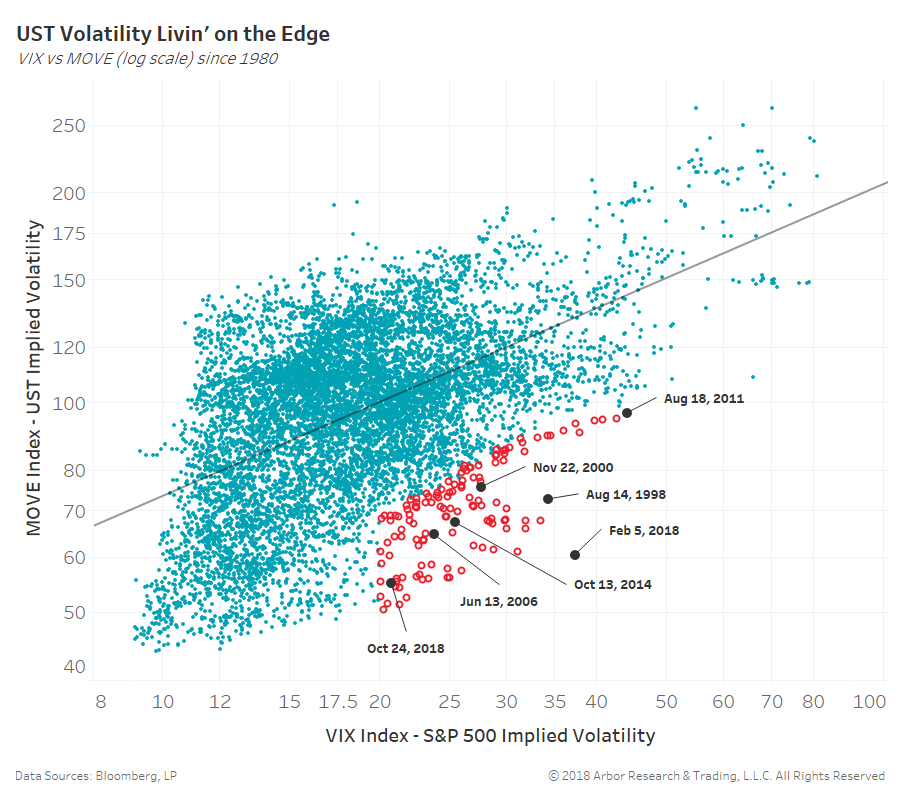
The VIX (S&P 500 implied volatility) has jumped above 20, which has historically been matched on average by the MOVE index (U.S. Treasury implied volatility) near 100. This time around bond investors are ‘cool as a cucumber’ with the MOVE index at a lowly 55.
Inflation expectations refuse to break out with nominal yields, indicating a less than 30% probability headline CPI can run above 2.5% year-over-year for the years to come.
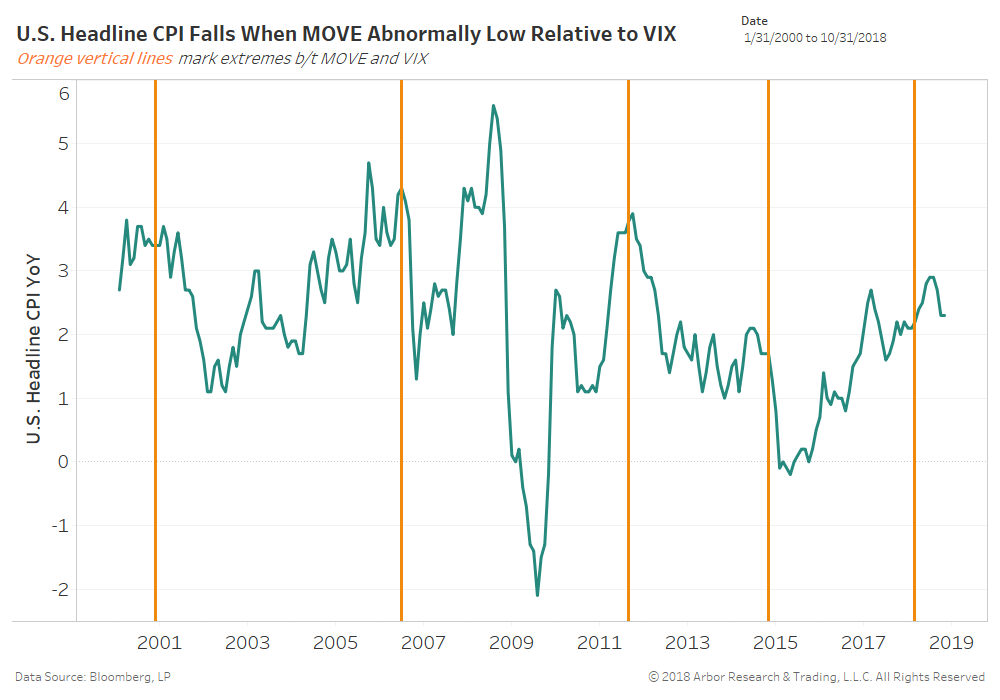
The last chart shows these instances of extremely low MOVE relative to the VIX as orange vertical lines on top of headline CPI.
U.S. headline CPI has tumbled after the prior four instances. Again, bond investors are NOT betting on inflation or robust economic growth.


