Summary
Comment
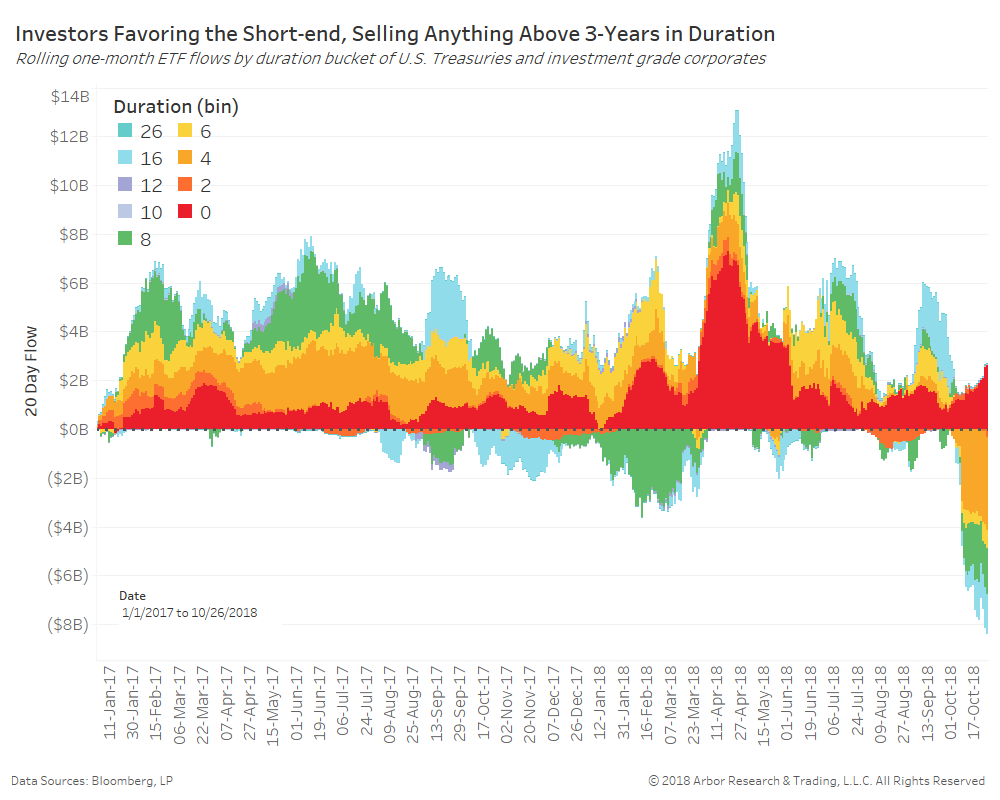
The chart below shows rolling one-month flows for U.S. Treasury and investment grade corporate ETFs by duration bucket.
Increasing volatility across risk assets is causing investors to deleverage portfolios and send flows to cash and cash-equivalents. Durations above three years are being sold at a rate not seen since the taper tantrum. Conversely, durations between zero and two years (red bars) are gaining more and more assets.
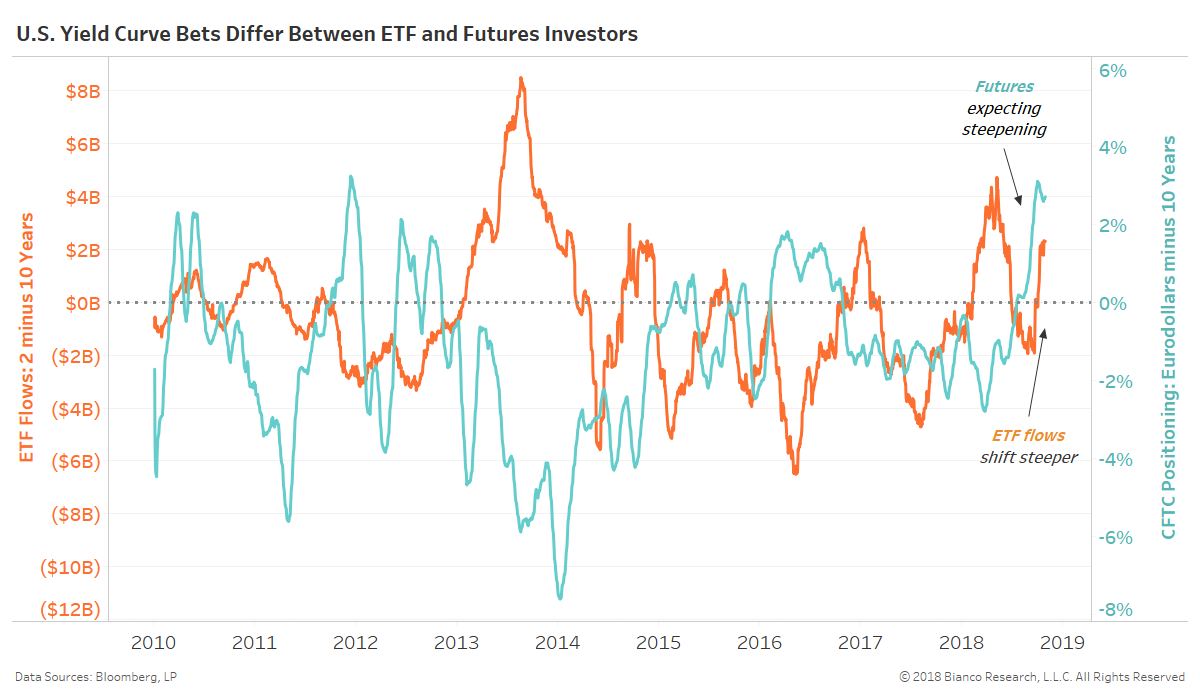
The chart below compares yield curve positioning by investors in ETFs to futures contracts.
- ETF positioning = Rolling three-month ETF flows for durations inside 2 years minus 6-to-10 years (duration weighted-spread).
- Futures positioning = Total net positioning as a percentage of open interest for eurodollars minus 10-years
Higher, positive values indicate positioning for steepening, while lower, negative values indicate positioning for flattening.
Investors via ETFs are seldom in agreement with futures over the path of the yield curve. Well, until now. ETFs and futures positioning are heavily biased toward a steepening yield curve.