- The Wall Street Journal – If GE Debt Gets Junked, Markets Have Reason to Shudder
Hopefully GE will end up merely as a case study in financial mismanagement, rather than the trigger for messy markets
The simplest difference is reassuring: GE hasn’t been downgraded to junk, and remains three rating notches above. The markets are treating GE bonds as though they had already lost investment-grade status; for example, the $1.3 billion January 2023 bond yield has leapt this year from 2.8% to 6.2%. But the credit-rating firms say that if GE’s restructuring goes as planned, there’s no need for further downgrades. If GE can get its finances under control, the panic will abate all by itself.

- Bloomberg.com – GE Could Be a $41 Billion Problem for Big Banks
GE has set up $41 billion in credit lines from dozens of banks
Five big U.S. banks committed to providing about half of thatWhen it comes to U.S. banks’ lending risk, it doesn’t get much bigger than General Electric Co. The five biggest Wall Street firms have committed to lending at least $3.5 billion each to the industrial giant facing concerns about the sustainability of its debt. GE has almost $41 billion in credit lines it can draw from, according to its latest quarterly regulatory filing. If fully tapped, the two main credit facilities would rank as the largest loans to any U.S. company that go beyond next year, data compiled by Bloomberg show. GE had used only about $2 billion of the available credit by the end of the third quarter, leaving itself ample room to pull more if necessary.
- CNBC – There’s a $9 trillion corporate debt bomb ‘bubbling’ in the US economy
At first glance, it looks like a $9 trillion time bomb ready to detonate, a corporate debt load that has continued to escalate thanks to easy borrowing terms and a seemingly endless thirst from investors. On Wall Street, though, hopes are fairly high that it’s a problem, but a manageable one, at least for the next year or two. The resolution is a critical one for financial markets under fire. Stocks are floundering, credit spreads are blowing out and concern is building that a combination of higher interest rates on all that debt will begin to weigh meaningfully on corporate profit margins. “There is angst in the marketplace. It’s not misplaced at all,” said Michael Temple, director of credit research at asset manager Amundi Pioneer. “But are we at that moment where this thing blows sky high? I would think that we’re not there yet. That’s not to say that we don’t get there at some point over the next 12 to 18 months as rates continue to move higher.”
Summary
Comment
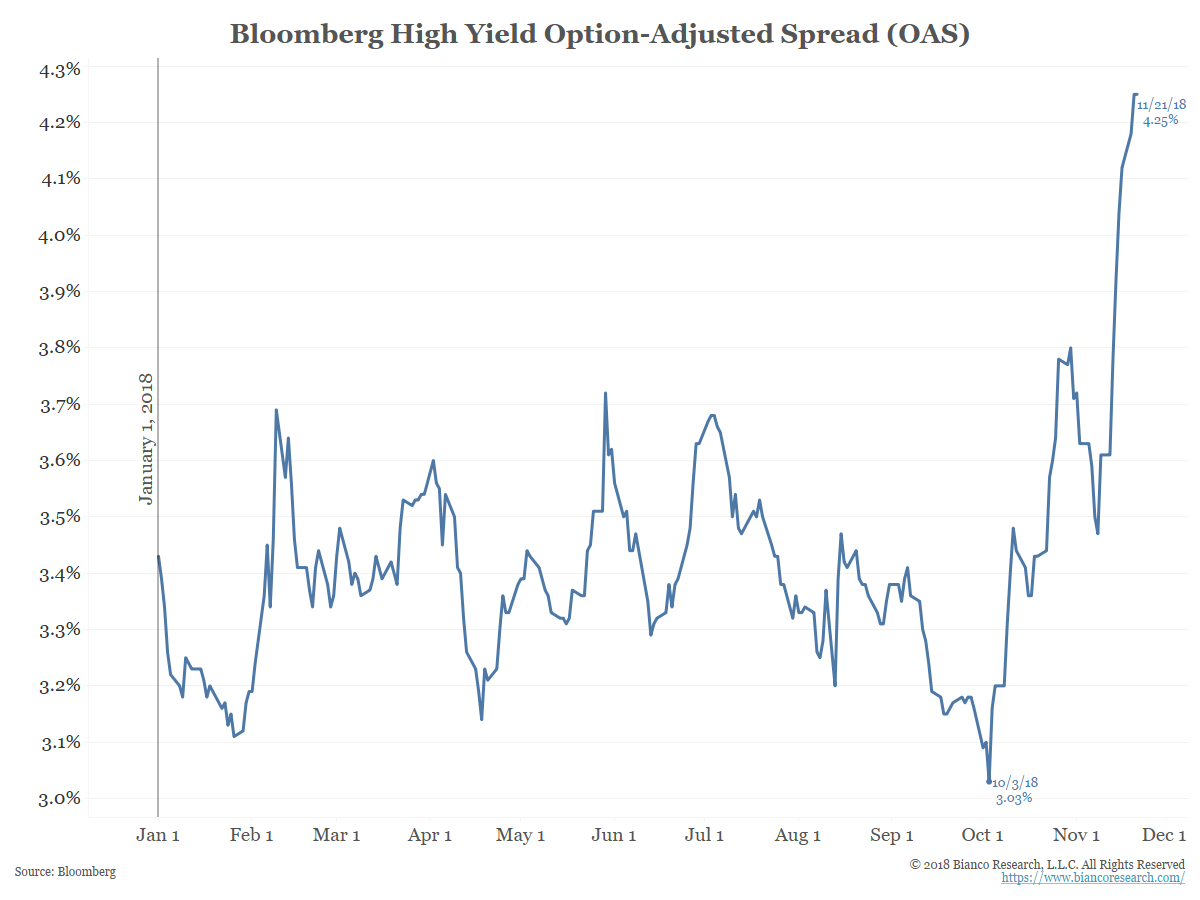
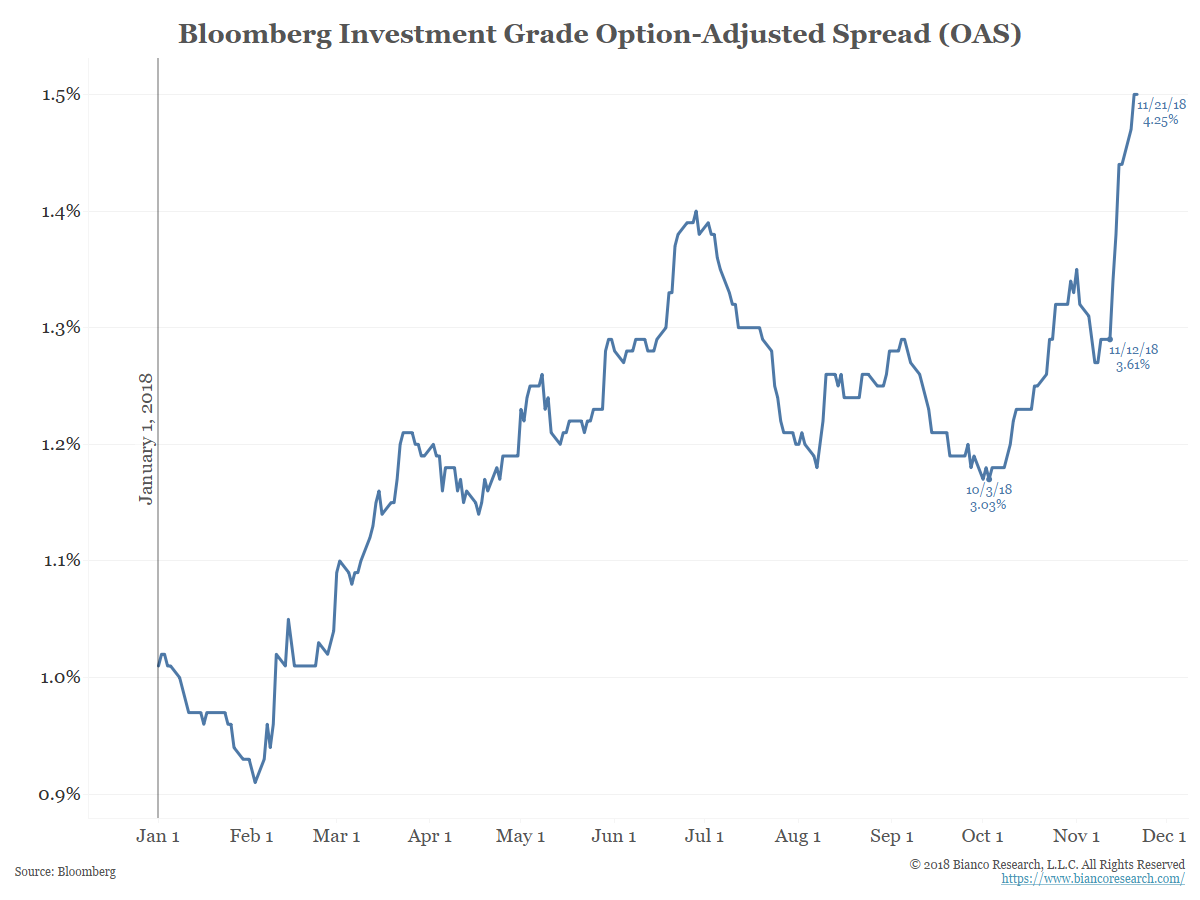
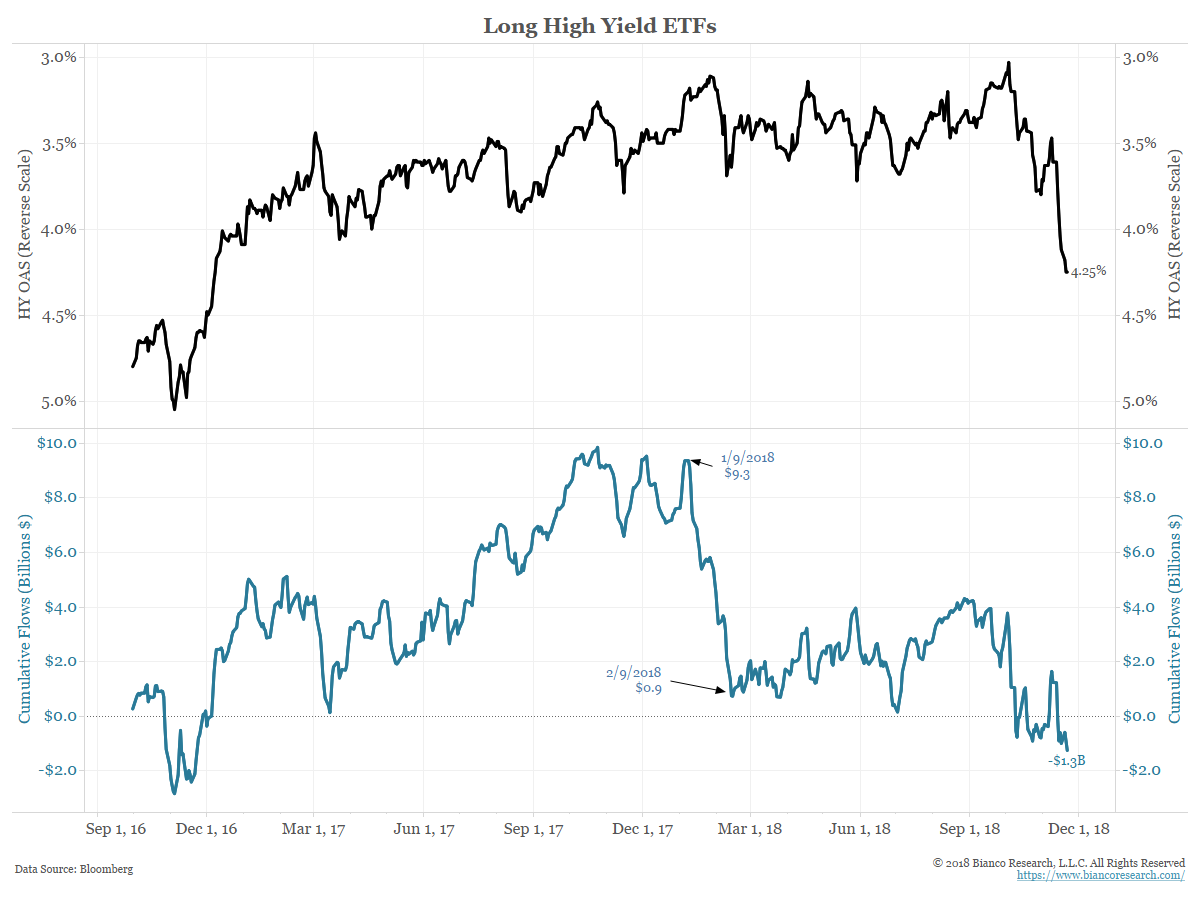
The two charts above show corporate bond option-adjusted (OAS) spreads. The widening over the last two months has been the focus of a lot of attention.
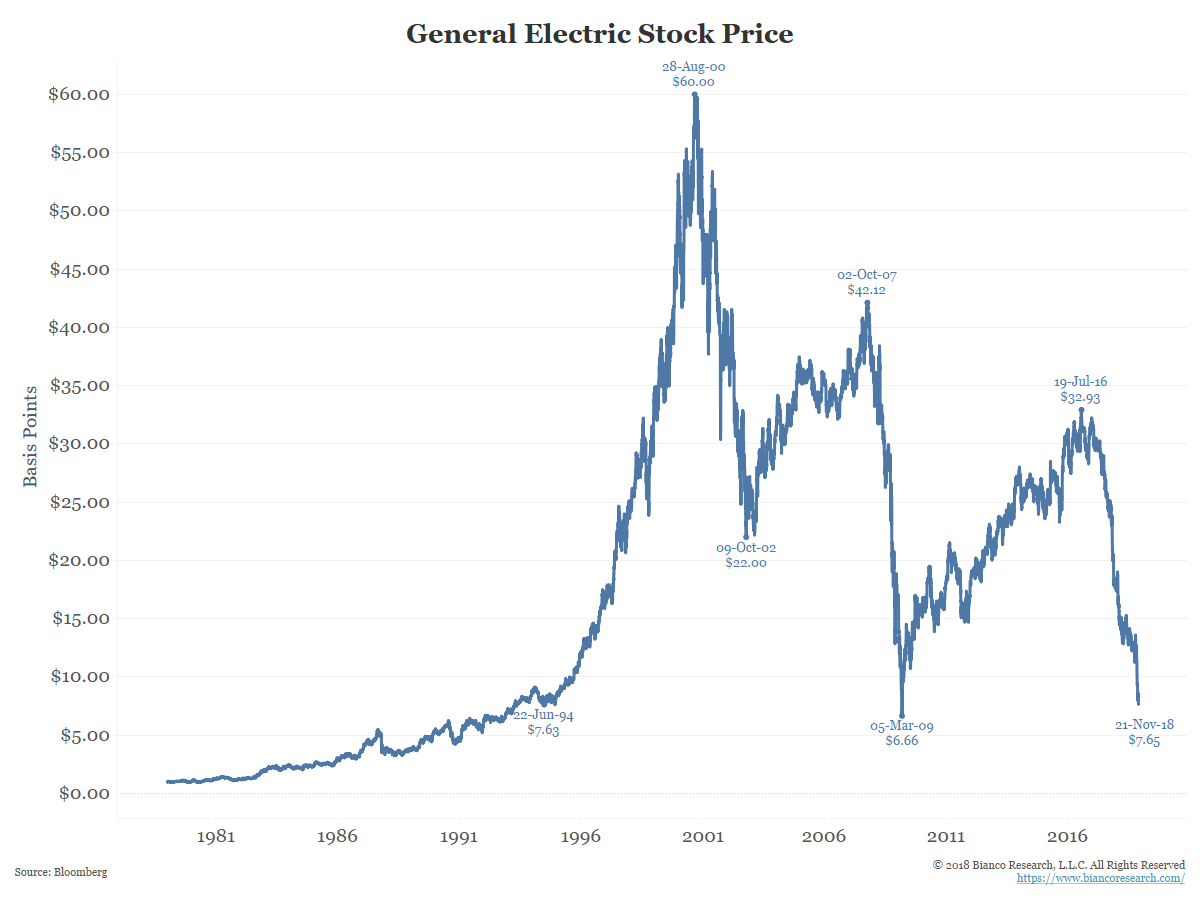
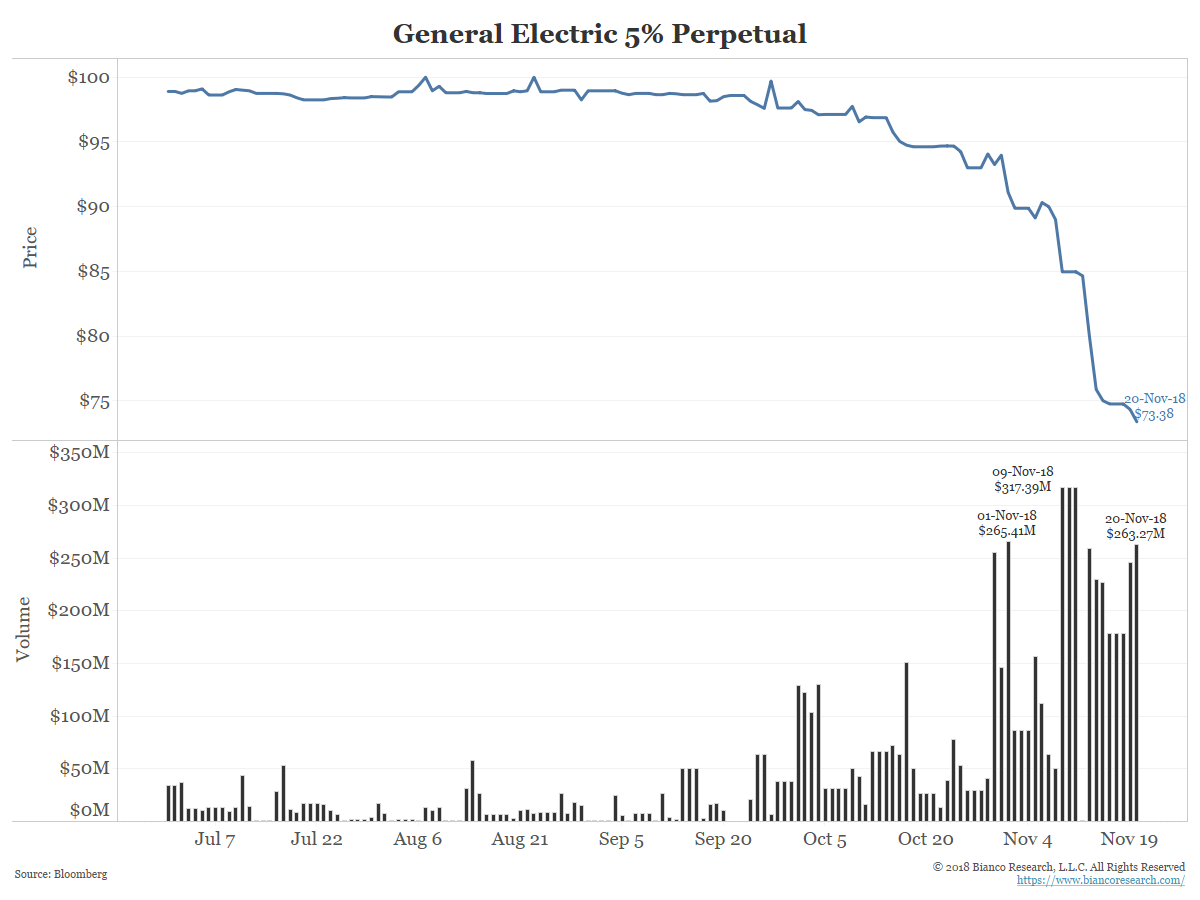
And within these indices, the issue that is getting most of the attention is General Electric. It starts with its stock price that is equaling the panic lows of 2009 and at levels last seen 25 years ago.
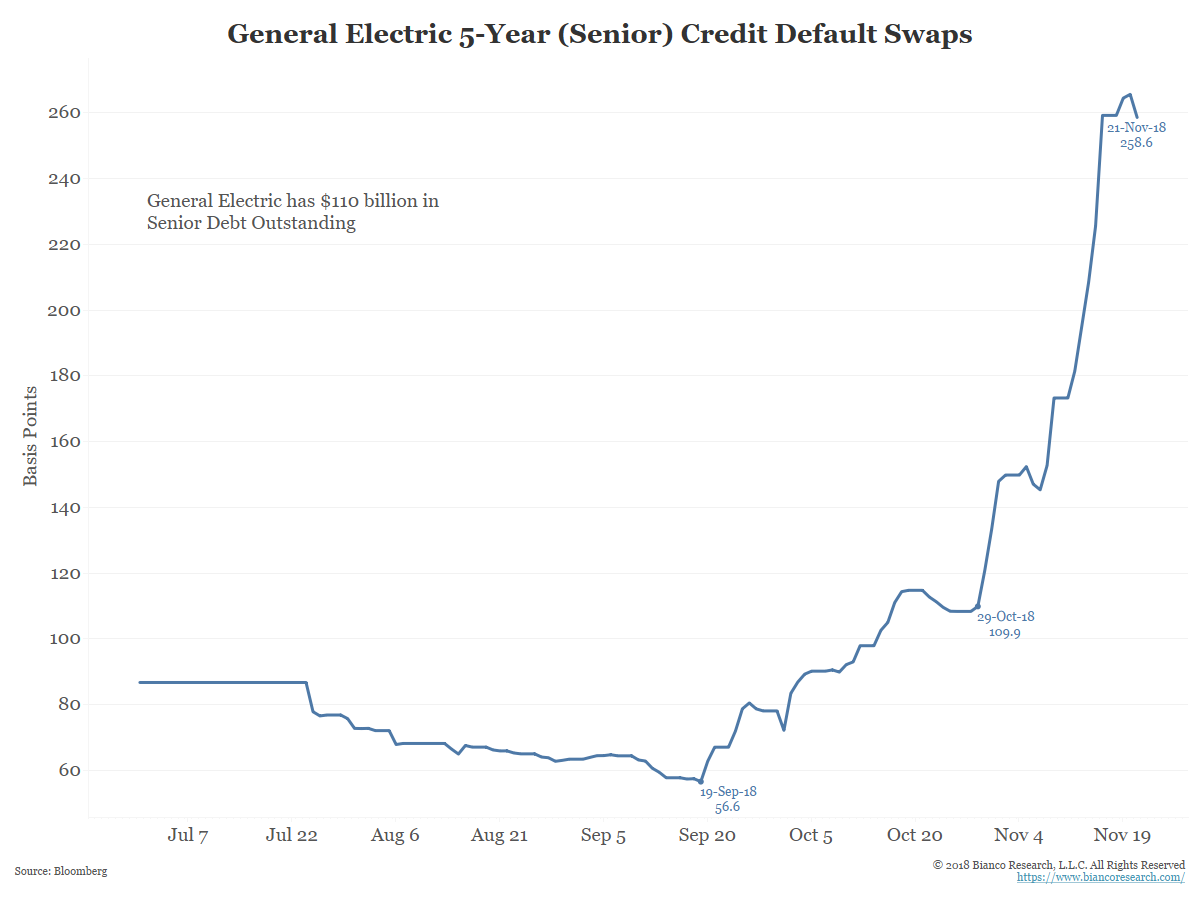
General Electric’s 5% perpetual is leading the corporate bond market’s most active list. It was issued in 2015 and is callable in 2021 at par.
If the corporate bond market has a single issue benchmark for this cycle, this is it. Note that yesterday (November 20) it closed at a new low for the sell-off on $263m in volume, the third highest volume ever.
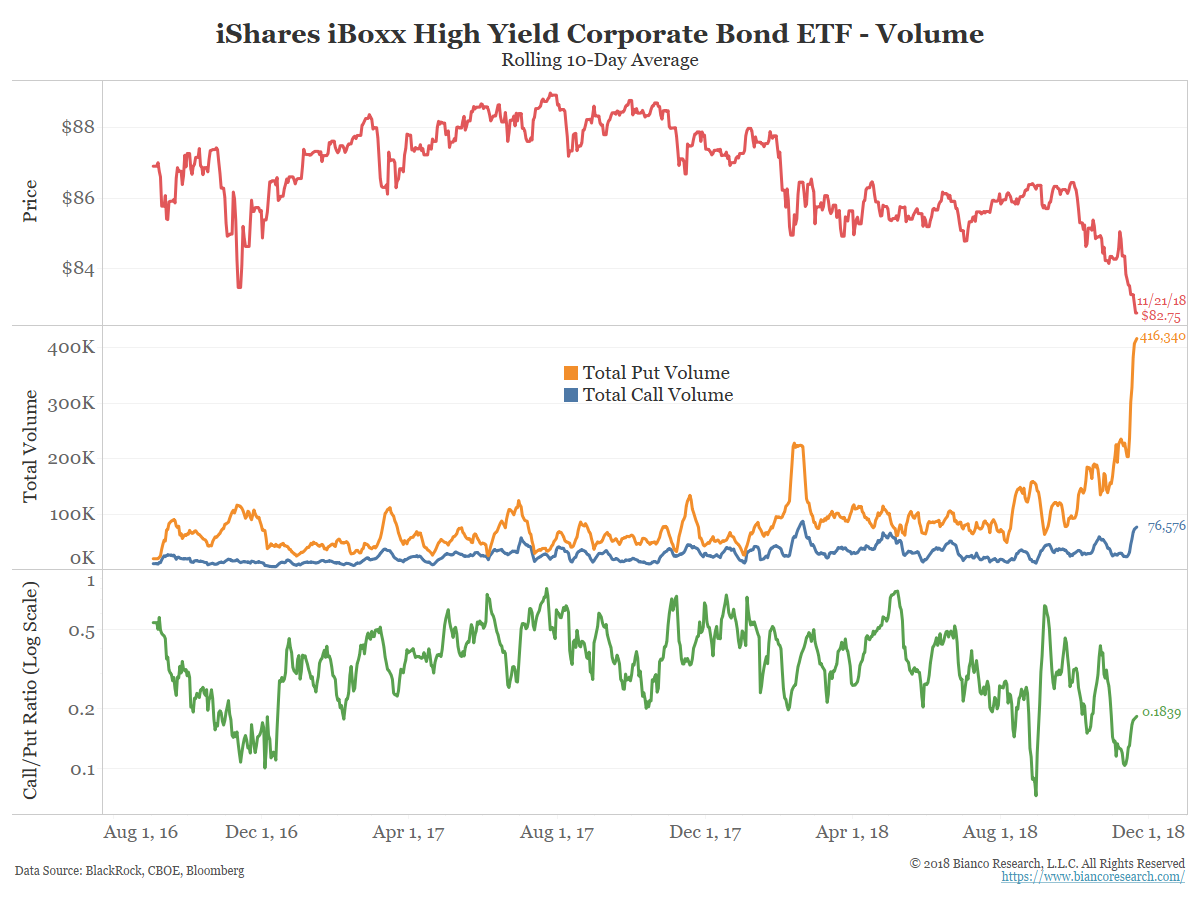
Hedging activity via high yield ETFs has exploded relative to the cash market. The blue line in the chart below shows the 10-day moving average of high yield bond volume currently stands at $6.04 billion, down from the March high near $11 billion.
The green line shows the 10-day value of all high-yield ETF trading. This totals about 30 ETFs. The orange line shows the trading value of the largest high-yield ETF, BlackRock’s iShares iBoxx High Yield Corporate Bond ETF (HYG).
The bottom panel shows high yield ETF dollar volume as a percentage of underlying cash volume. High-yield ETFs (green) now account for more than 56% of the volume of the cash market. HYG is over 39% the size of the high-yield market.
As we have been discussing the last few weeks, ETFs are consuming the high yield market.

Conclusion