-
 Bloomberg – Fed’s Reverse Repo Facility Usage Sinks Below $300 Billion
Counterparties parked $292 billion on Tuesday: New York Fed
Balances have been dropping amid resurgence in bill supply
Market participants are closely watching the pace at which the facility, known as the RRP, empties. Some on Wall Street warn the draining facility is evidence that excess liquidity has been removed from the financial system and bank reserve balances are less abundant than policymakers believe.
Summary
Comment
The Federal Reserve created its Reverse Repo (RRP) facility about ten years ago. This facility allowed market participants to park cash at the New York Federal Reserve in exchange for competitive interest rates. That rate is set 20 basis points below the top end of the Federal Reserve’s target rate. Today, the target range is 5.25% to 5.50%, so the RRP rate is 5.30%.
The purpose of this facility is to drain excess funds from the financial system. When money is parked at the Fed, it cannot be re-lent, known as rehypothecation, thereby reducing the amount of liquidity in the financial system. When this facility falls, these funds are reintroduced back into the financial system, thereby adding liquidity.
Who uses this RRP facility?
Banks do not generally use this facility, as the Fed has a second facility that pays interest on reserves, known as IOR. The IOR rate is set to be ten basis points below the top of the target fed funds range, or 5.40%. So, it would make no sense for a bank to use the RRP that pays 5.30% when the IOR pays 5.40%.
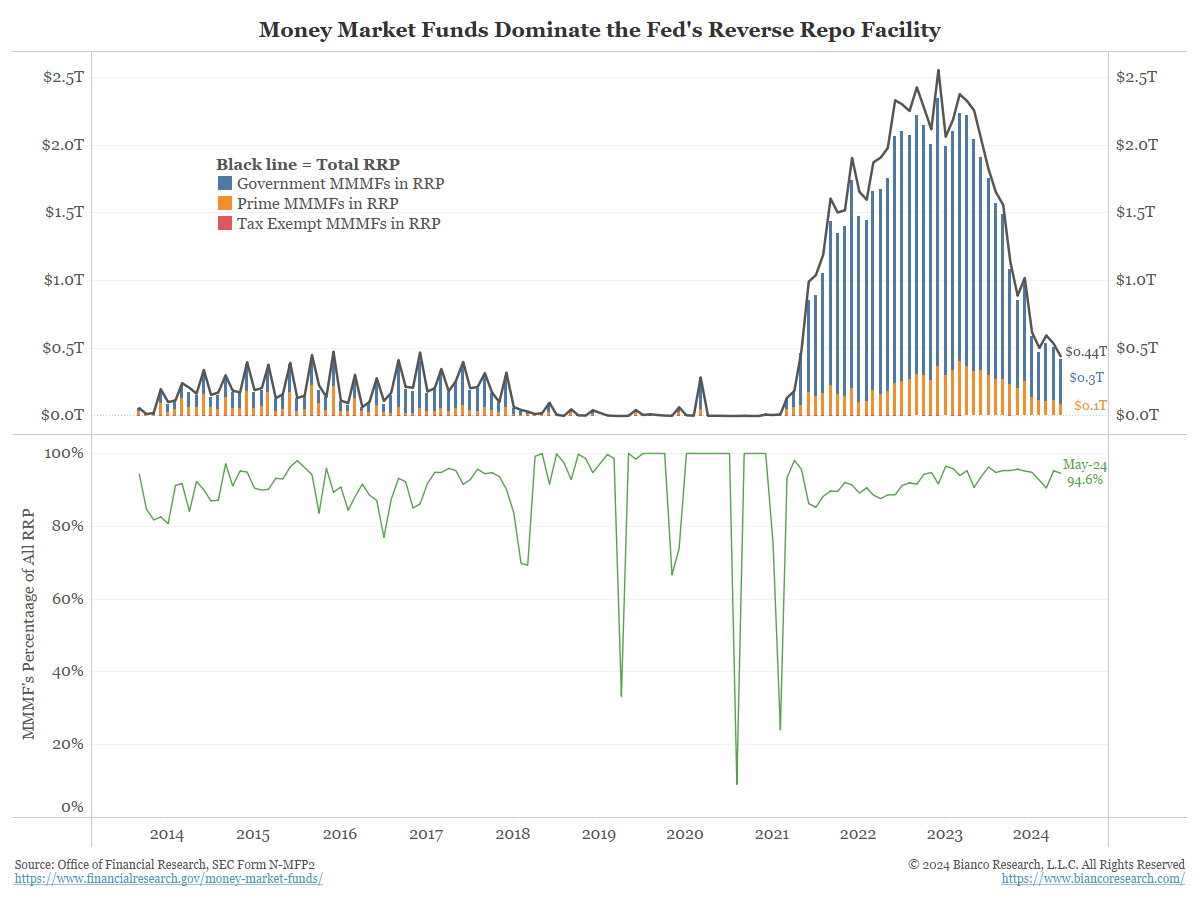
As the following chart shows, about 95% of the usage of this facility comes from money market funds (bottom panel). The other 5% is from government-sponsored enterprises such as the Federal Home Loan Banks.
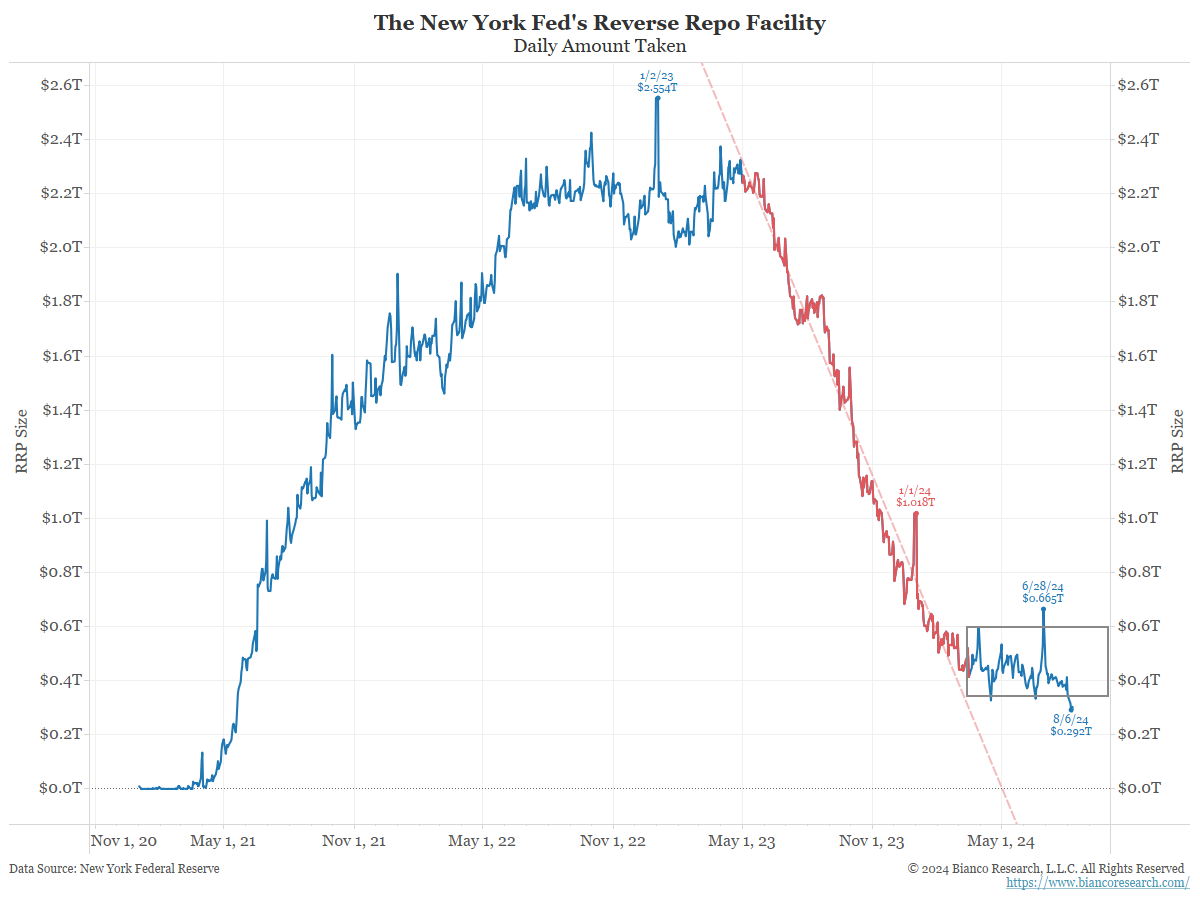
The chart above has various colors and annotations.
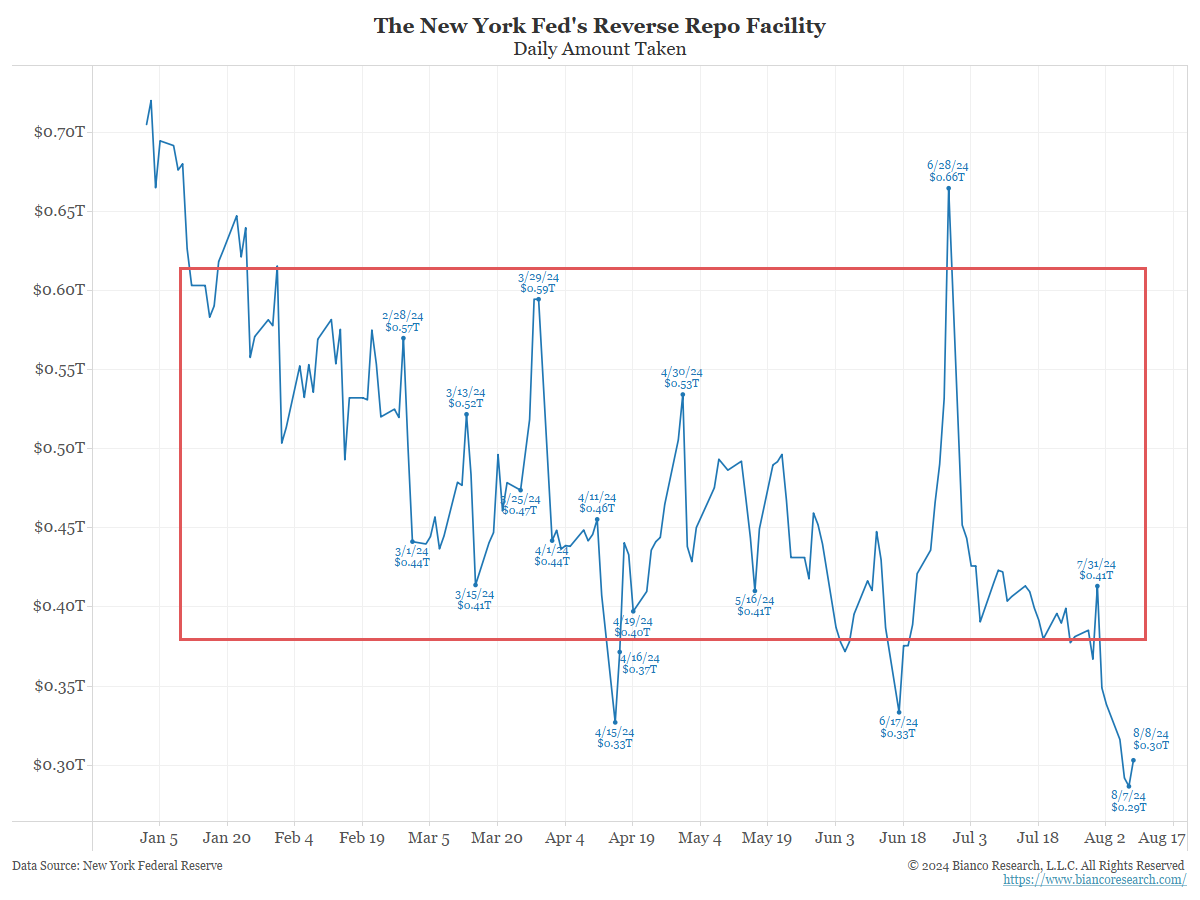
The red part shows it falling from $2.2 around July 2023 to about $400 billion in March 2024. Over the last several months, this facility has trended in the rectangle until breaking lower this week.
So, why did it fall (the red part)? Before we answer this, we need to explain a quick note on managing money market funds.
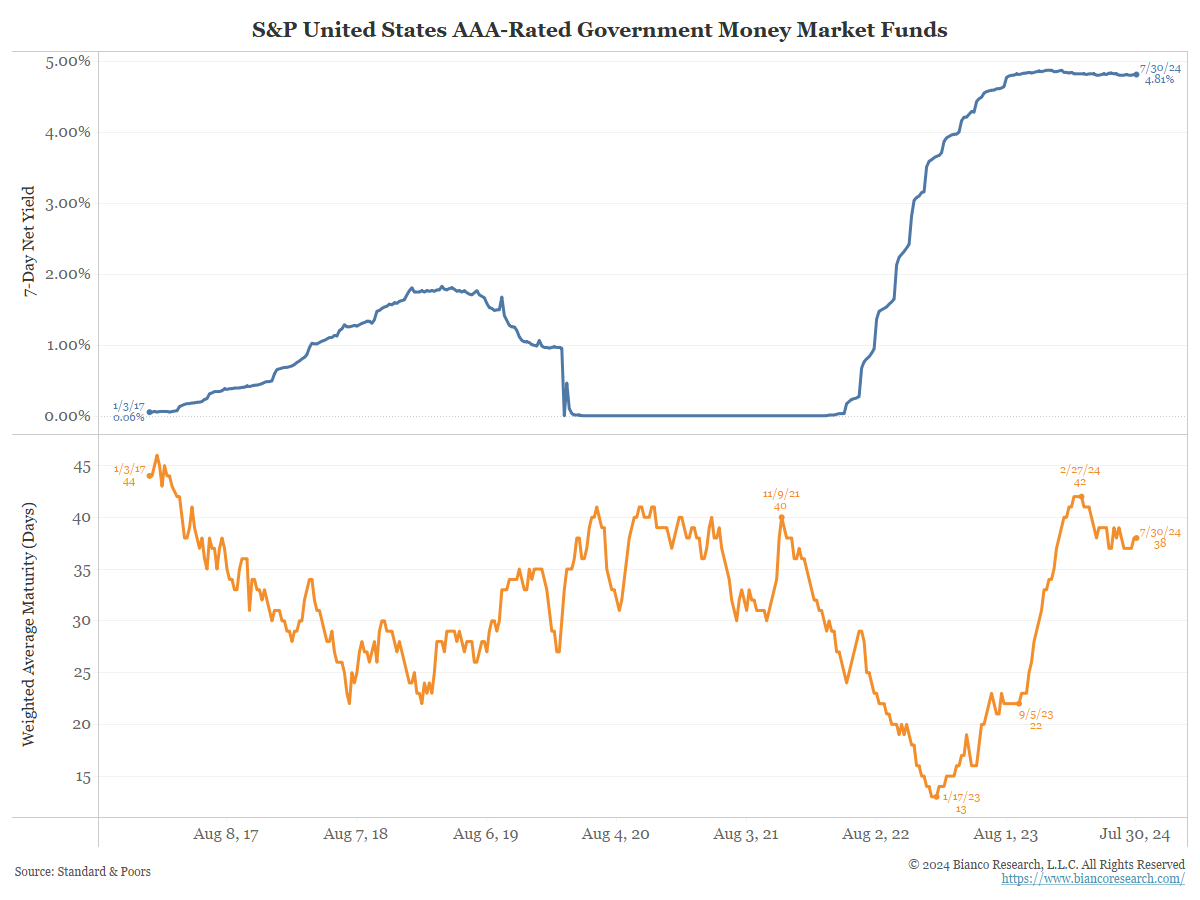
The top panel (blue) in the next chart shows the average yield of a money market fund. The bottom panel (orange) shows the weighted average maturity, in days, of money market portfolios.
When rates rose (blue), money funds shortened their average maturity (orange). Why? Short-term securities are illiquid, like T-bills or term-repos (repurchase agreements longer than one day). It is hard to sell them before maturity, but since maturity is only a few days away, it is generally not a problem.
So if a money market fund manager thinks short-term rates will rise, they shorten their maturity as much as possible. They want their securities, with the fixed rates, to mature ASAP so they can reinvest these proceeds at higher rates.
Remember, the money market fund business is brutally competitive, and marketing revolves around their average yield.
The RRP represents a competitive rate for money market funds, now 5.30%, on a one-day (overnight) maturity. It is also from a super-safe counterpart, the New York Federal Reserve.
When the Fed was hiking rates, it made sense for money market funds to pile into this overnight facility and “roll it over” daily. And they did, as the RRP amount taken rose to $2.5 trillion. At this peak, the RRP accounted for about half of all assets in money market funds.
When the Fed stopped hiking in July 2023, the parlor game of timing the first rate cut began. As the orange line above shows, money market funds started to lengthen their average maturities to 42 days by February 2024. They did this to lock in the current short-term rates for as long as possible. This allowed the funds another few months to advertise higher yields to attract money.
In other words, the RRP facility is just another option for money market managers when viewing the environment driving interest rates.
So why did the decline in RRP usage stop around $400 billion around March 2024? The next chart offers a shorter-term look at the RRP chart above.
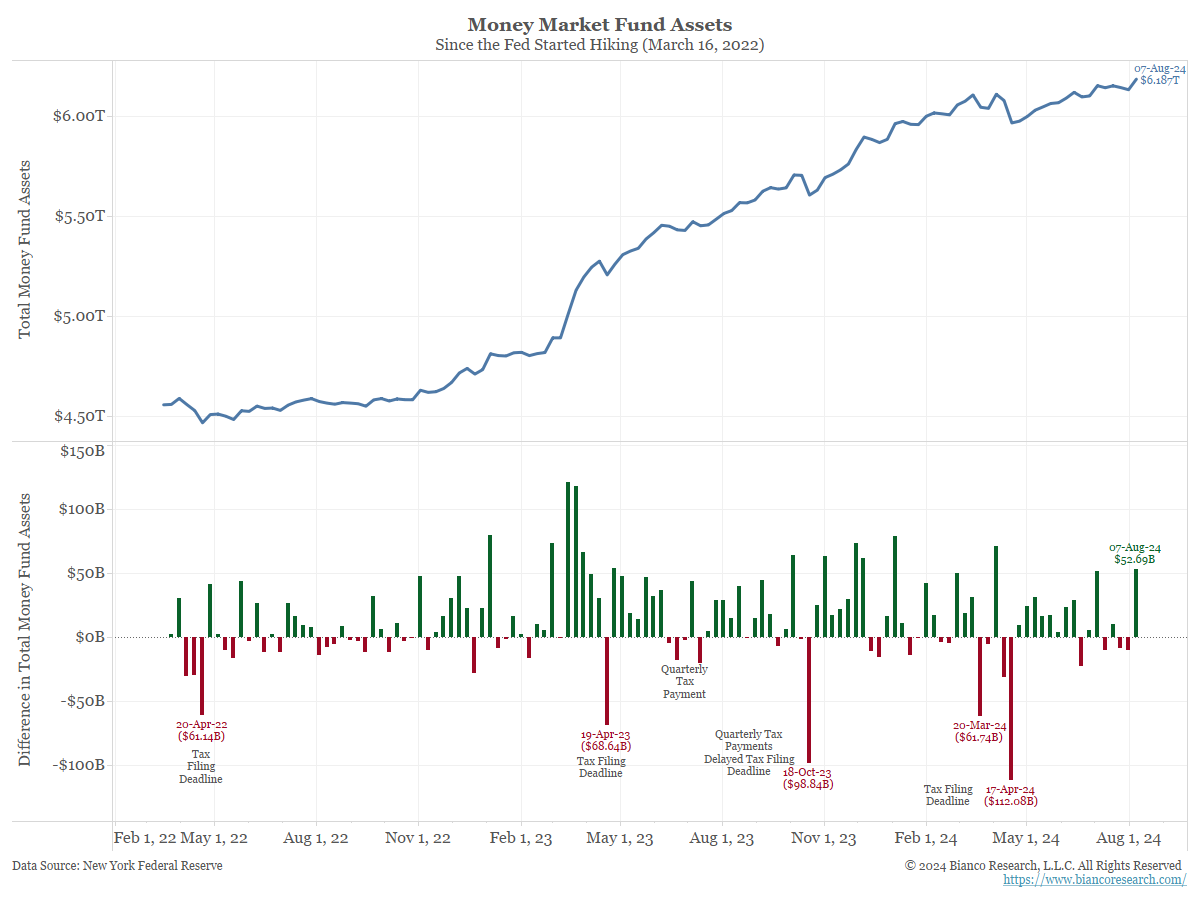
Consider the next two charts to understand why the RRP’s usage trended sideways until a week ago.
Money funds are attracting tons of new money. Their assets rose to a new high (blue). They even got another $52 billion in new money last week (bottom panel). So, the drop in RRP this week was not due to money funds liquidating to meet redemptions.
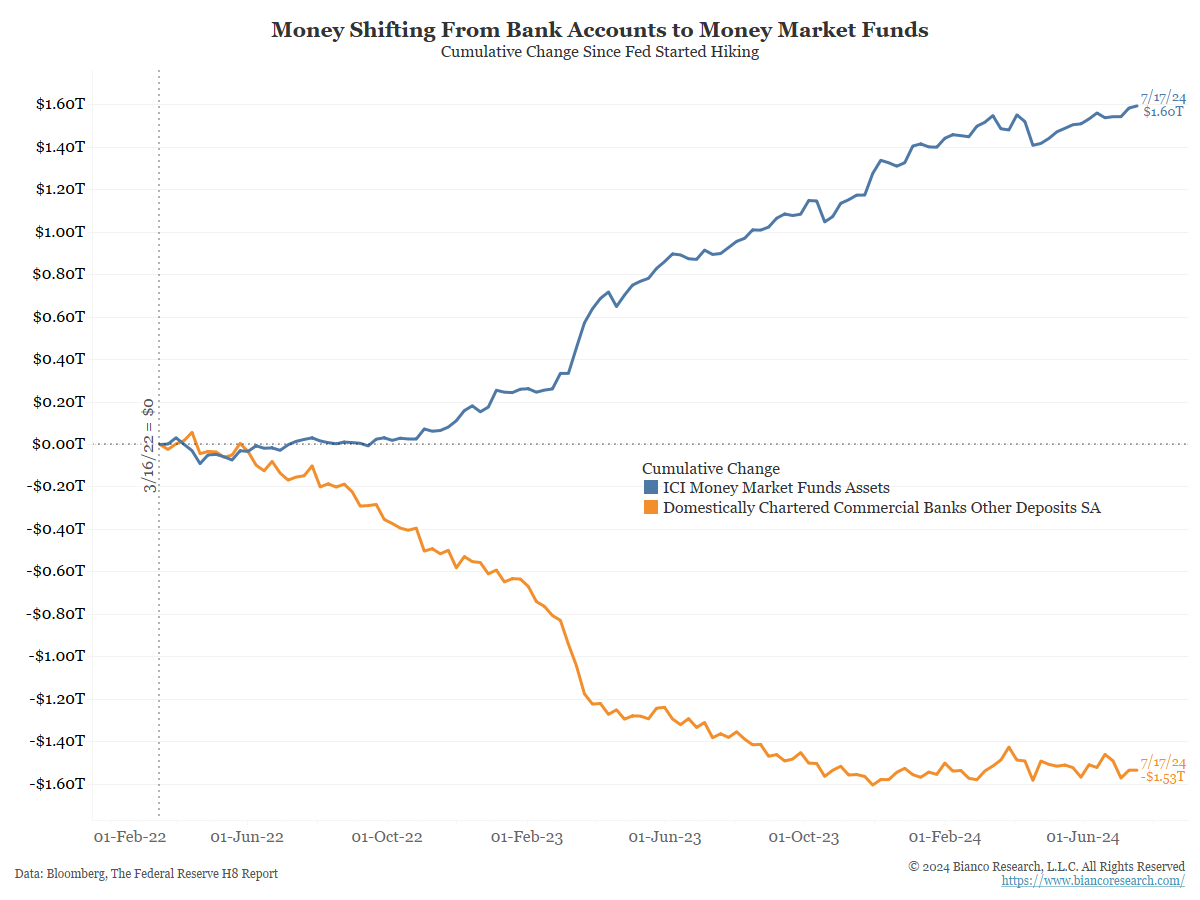
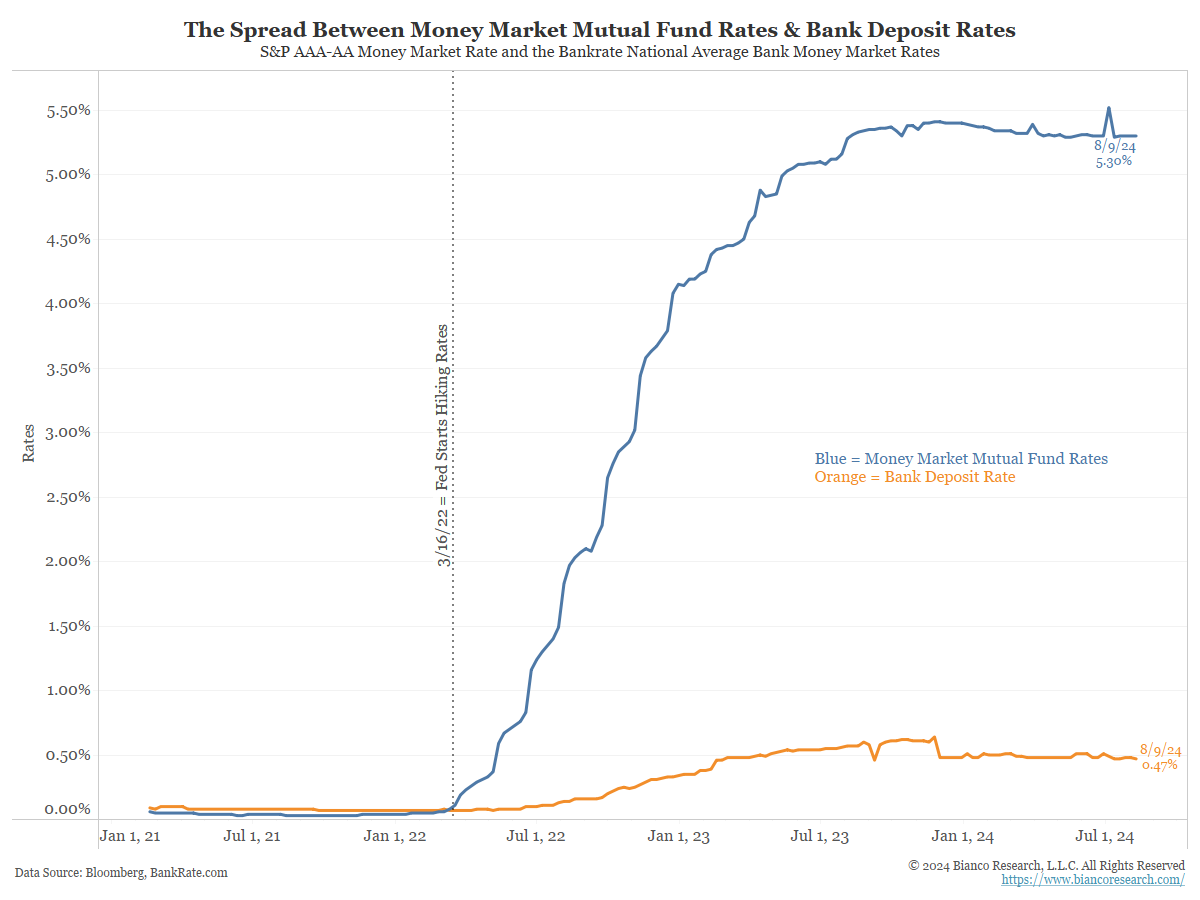
Money market funds are now replacing bank deposits as a means of “warehousing” money. Not only are consumers moving bank money into these funds, but they are also paying their bills out of money market funds and even having their paychecks directly deposited into them.
So, money fund managers need to think more like bank deposit managers and ensure they have readily available money for bill-paying cycles. With its competitive rate and super-safe counterparty, the RRP facility makes money available daily, which is a convenient way to accomplish this.
Given this, we argued earlier this year that this facility would keep anywhere from $200 billion to $400 billion in the RRP for operational purposes. In other words, we do not see this facility being drained to zero. Even with the decline this week, this still appears to be the case.
So, why is the RRP declining this week?
Money market funds think the Fed will finally cut rates in September, if not before. Managers are scrambling to buy Treasury bills to lock in rates yielding at least 5%.
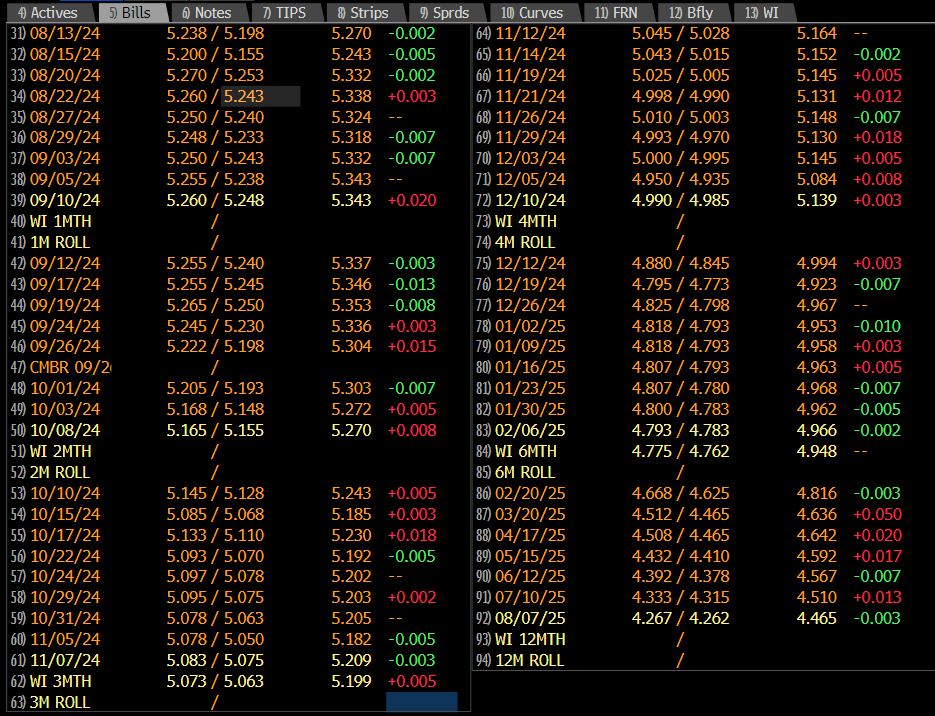
The table below shows the yield available on all available Treasury bills. Note that Treasury bills out to December still yield at least 5%. So, money funds are using RRP funds to buy these bills to ensure their marketing departments can keep advertising a 5% yield available until the end of the year.
Why not wait and keep getting a 5.30% with the RRP until right before the Fed cuts? The risk is that these Treasury bill yields attract more buying ahead of the expected cut and start diving, removing the opportunity to lock in a 5% yield. Grab it now while it is still available.
Conclusion

