Comment
<Click on chart for larger image>
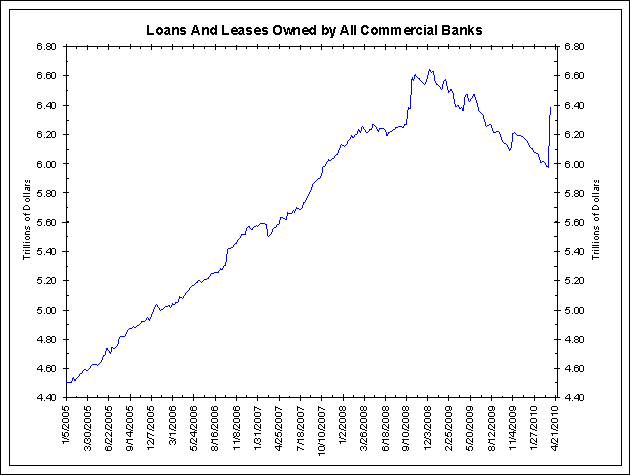
While some have gone as far as suggesting this $421.80 billion in extra bank loans is a secret bailout of the EU, the accounting rule changes above offer a much more feasible explanation for the spike in the above series. Banks held a lot of off-balance sheet loans and leases in special purpose entities (SPE), and they are only now being accounted for in the H.8 data.
Although this data used to be one of the better barometers of banks’ ability and willingness to hand out loans, a series break such as this renders the data much less useful. At this time it does not appear that the Federal Reserve has any desire (nor probably the ability) to reverse engineer this series as if SPE assets were always included on banks’ balance sheets.
So what would this series look like if we could magically backward revise it? One way to reverse engineer this data would be to simply add the $421.80 billion difference between this week and last to the entire history of the data, shifting the historical data up by that amount. While this would be a fairly simple way to approximate historical data including SPE assets, it assumes these assets remained a constant $421.80 billion.
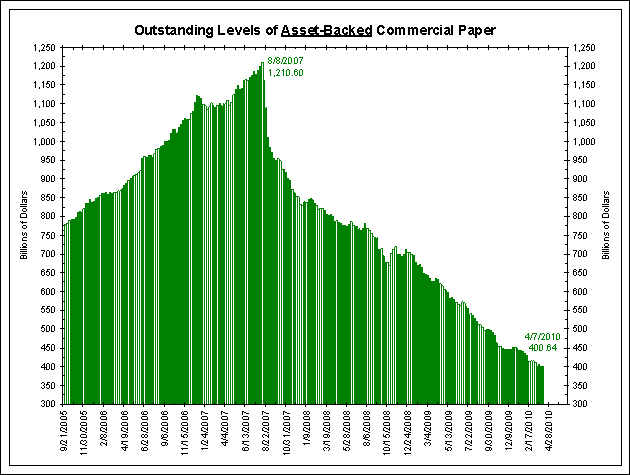
Because the SPE’s were often financed by asset-backed commercial paper (ABCP), perhaps we could use the outstanding levels of ABCP as a proxy for the size of SPE’s at any given time. As the chart below shows, outstanding ABCP totaled $400.64 billion as of April 7, 2010 – roughly in line with the increase in loans and leases in the latest H.8 data. While the size of SPEs can’t be directly correlated to the size of the ABCP market, the $1.21 trillion peak in ABCP in August 2007 argues that the SPEs could have held much more than their current level of $421.80 billion in loans and leases.
<Click on chart for larger image>
Conclusion
One of the most important ingredients to the recovery of the financial system would be increased bank lending. Now that the FASB reclassification has muddled one of the better measures of banks’ willingness to lend money, we are left wondering how the “new” series would look historically. While admittedly neither of the attempts at reverse-engineering this data mentioned above would pass close scrutiny, we are not sure what other options we are left with if we plan to continue to use the H.8 bank loan data as a measure of banks’ willingness to lend.


On January 15, 2010, the Federal Reserve added the following announcement to its usual weekly release of banking statistics (H.8 data):
Supplementary Information Regarding Banks’ Adoption of FAS 166 and 167
The effects of banks’ adoption of FASB’s Financial Accounting Statements No. 166 (FAS 166), Accounting for Transfers of Financial Assets, and No. 167 (FAS 167), Amendments to FASB Interpretation No. 46(R), will be incorporated in the H.8 commercial bank balance sheet data for March 31, 2010 (to be published on April 9, 2010).
For more information on FAS 166 and 167, please see the Financial Accounting Standards Board’s news release.
In a nutshell, FAS 166 and 167 are the rules forcing banks to move their off-balance sheet assets back onto their books. Although the banks’ adoption of these accounting changes has been known since June 2009, the changes did not show up in the H.8 data until March 31, 2010. Perhaps because these new accounting standards were announced so long ago, the chart below is now catching some off guard.