What is the worldwide price of crude oil?
If you’re like most, you will look up the nearby crude oil futures contract that trades on the New York Mercantile Exchange (NYMEX). Yesterday (February 8th) the March 2011 NYMEX contract closed at $86.94/barrel, down 43 cents. This contract is based on the price for “sweet” (low sulfur) Cushing Oklahoma delivered crude oil. But, is this price misleading? Could the true worldwide price actually be above $100/barrel? We believe the answer is yes. Let us explain.
Many Benchmarks For Crude
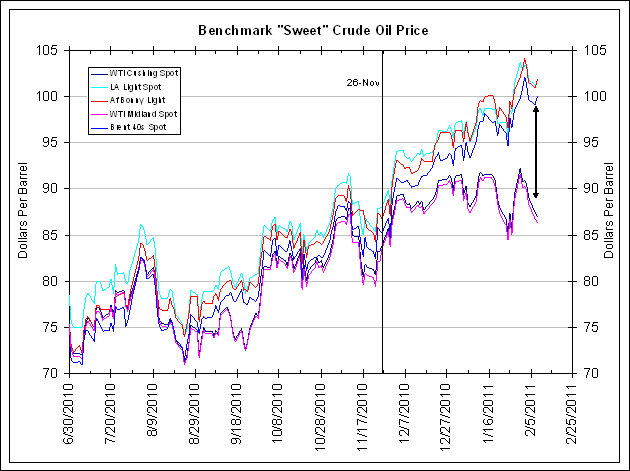
As the next chart below shows, a divergence has opened up between various sweet benchmark crude oil prices. For this analysis we will focus on similar grades of sweet crude oil like that found in Cushing Oklahoma. (The other major grade is high sulfur “sour” crude which usually trades at a discount to sweet crude oil. Sour crude oil is more expensive to refine, making it less desirable.)
In the chart below, the mid-continent U.S. pipeline delivered benchmarks of West Texas Intermediate (WTI) in Midland Texas (pink line) and WTI in Cushing Oklahoma (black line) are trading around $87/barrel.
However, the other sweet crude oil benchmarks are trading around $100/barrel. These are the waterborne (tanker) cargoes originating out of the Bonny oil terminal in Southern Nigeria (Bonny Light in red), the North Sea cargoes from the Sullom Voe oil terminal in Shetland Islands, Scotland (Brent 40s in blue) and St. James Parish in Louisiana that connects to the Louisiana Offshore Oil Port or LOOP (LA Light in Cyan). The Brent crude oil benchmark is the underlying cash market for the Brent futures contract traded on the Intercontinental Commodity Exchange (ICE).
<Click on chart for larger image>
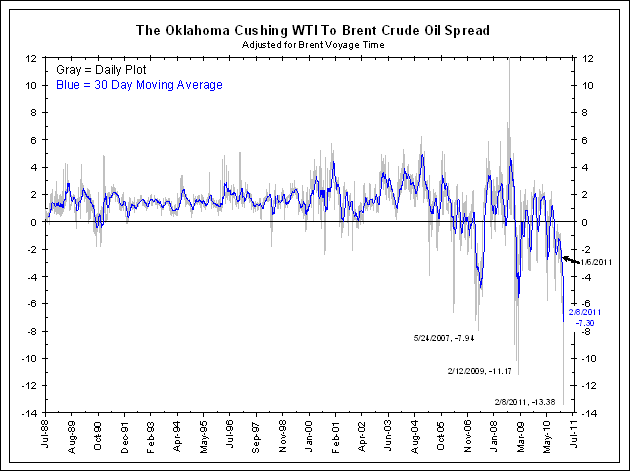
How unusual is the divergence highlighted with the arrow above? As the next two charts show, this spread is not only a record, it has moved to a level that many crude oil experts would have thought to be impossible just a few months ago.
<Click on chart for larger image>
As the chart above shows, prior to a few years ago WTI delivered in Cushing would usually trade slightly higher than Brent crude oil. This reflected the premium for Cushing as a pipeline-delivered crude oil, making it cheaper than a tanker-delivered cargo like Brent crude oil. But in recent years supply considerations have made this relationship unstable to the point that spot WTI prices are now trading a record $14.50 (16%) below spot Brent prices.
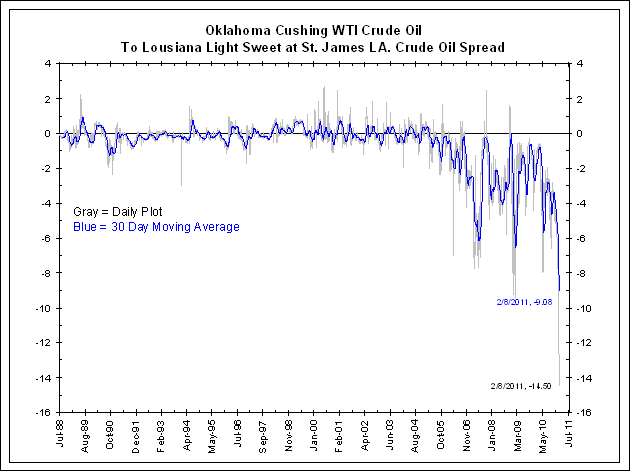
This is not merely a geopolitical issue brought on by the situation in Egypt. The chart below shows tanker-delivered crude oil in Louisiana versus pipeline-delivered crude oil in Oklahoma. The crude delivered to these two points in the United States that are only a few hundred miles apart have a difference in price of $14.50 (17%), larger than the WTI/Brent spread. This cannot be the result of unrest in Egypt.
- Bloomberg.com – Louisiana Oils Reach Widest Premiums to WTI Since at Least 1991
The premiums for Light Louisiana Sweet and Heavy Louisiana Sweet crudes rose to the highest levels against West Texas Intermediate since at least 1991 as the U.S. benchmark fell against its European counterpart. The spread between March-delivery futures for WTI and Brent, the basis for European and West African crudes, increased 97 cents to a record $11.77 a barrel. A larger premium for Brent makes imports to the Gulf Coast more expensive than U.S. grades. “The bottleneck at Cushing is depressing the price of WTI because it’s landlocked,” said Sung Yoo, an analyst with JPMorgan Chase & Co. “WTI is trading at a discount relative to all the other global crudes.” Light Louisiana Sweet’s premium strengthened 70 cents to $13.50 a barrel at 2:12 p.m. in New York, according to data compiled by Bloomberg, the widest gap since 1991 when Bloomberg began collecting the data. Heavy Louisiana Sweet’s premium to WTI increased 50 cents to $12.50 a barrel.
It is important to note the highlighted passage above. Cushing, Oklahoma is landlocked and obtains its crude oil from pipelines that intersect at this critical juncture.
<Click on chart for larger image>
Keystone XL Pipeline
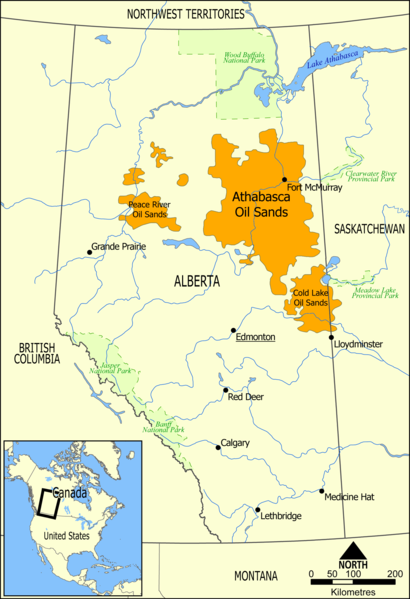
According to the Oil and Gas Journal (OGJ), as of January 2009 Canada had 178 billion barrels of proven oil reserves, second only to Saudi Arabia. Over 95% of these reserves are oil sands deposits in Alberta. These reserves are more difficult to extract and process than conventional crude oil and become economic at higher prices, which has been happening in recent years.
Canada is a net exporter of oil, with 2008 net exports of 1.0 million bbl/d. Almost all of it flows to the United States via pipeline.
- The Globa & Mail (Canada) – TransCanada ramps up oil supply in new Cushing line
TransCanada Corp. has opened the spigots on a new pipe carrying Canadian oil to a major U.S. hub that’s already awash with supply. The company has begun pouring oil into its Cushing Extension pipeline, a 591,000 barrel-per-day pipe that connects Steele City, Neb., with Cushing, Okla. Although observers believe the extra supply could further suppress the benchmark price for West Texas Intermediate crude, the company contends it is unlikely to make much of a difference.
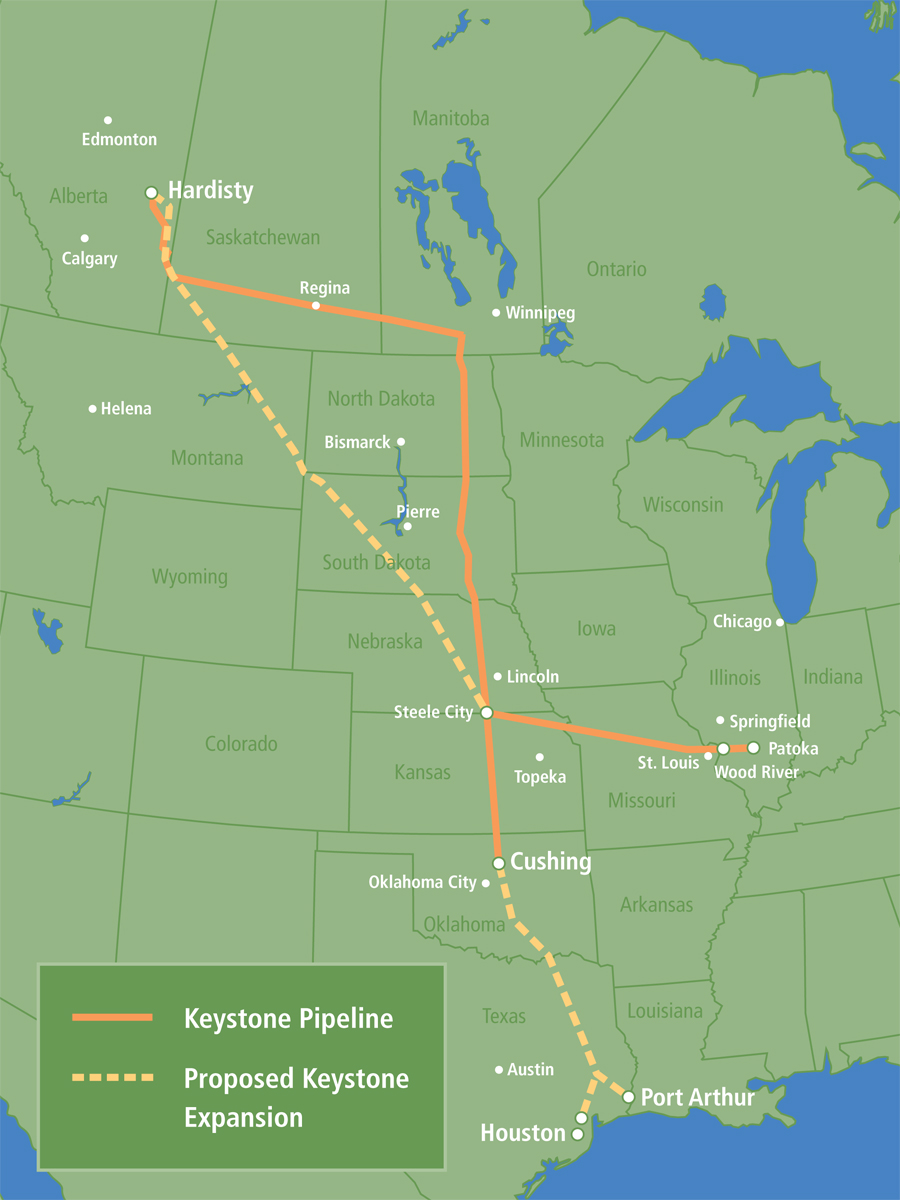
In 2005 TransCanada began construction on the 2,147 mile $12 billion Keystone XL pipeline (below). This 36-inch pipeline has been coming online in recent weeks and is carrying Canadian Oil Sands crude oil from Alberta to Cushing Oklahoma. When fully operational it will carry about 600,000 barrels/day. Phase 3 of this project will continue this pipeline down to the Gulf Coast and is scheduled to be completed in 2013.
<Click on graphic for larger image>
A Glut At Cushing
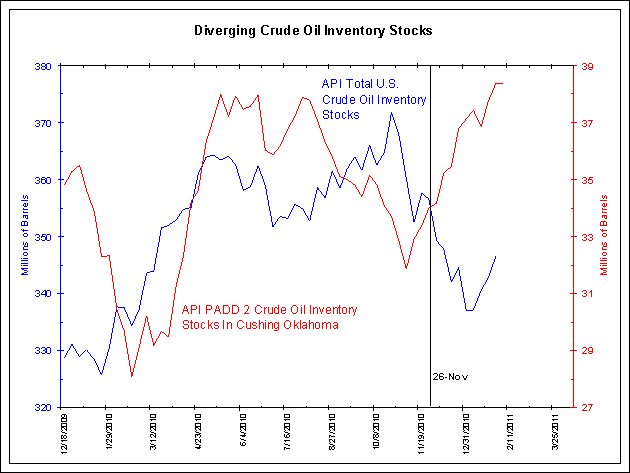
As the next chart shows, in recent weeks crude oil inventories in Cushing Oklahoma have been booming thanks to the Keystone XL pipeline. The red line shows crude oil stocks in Cushing Oklahoma have been going straight up since November 26. The blue line shows crude oil stocks in the entire country have been falling over the same period. The first chart above of benchmark crude prices also highlights November 26. Notice how WTI Midland and Cushing prices started to diverge from other world benchmark prices when inventories started to boom in Cushing.
Since Cushing is “the price of crude” for most financial market participants, do they realize that most benchmarks are at or above $100/barrel and up 20% since Thanksgiving? They are not unchanged near $87 as the NYMEX prices suggest.
<Click on chart for larger image>
How Does This Resolve Itself?
It’s hard to believe in 2011 that crude oil can trade at $86/barrel in Oklahoma and over $100/barrel in Louisiana. If you think this cannot last, you’re right. See the next story.
- Reuters – Several US oil terminals plan to move crude by rail
Up to a dozen railroad terminals to load, unload and store oil are sprouting up around the United States as oil shippers turn to railroads to deliver barrels into markets where crude is priced higher. Growing Canadian and North Dakota oil supplies are heading to Cushing, Oklahoma, in pipelines that can’t deliver them further south. Flexible rail routes could allow oil cargoes to move to destinations where oil fetches a premium, and avoid a 38 million barrel glut of oil sitting at Cushing.
The U.S. crude oil pipeline system does not flow from Cushing to Louisiana. Until now there has been no reason for crude to flow in that direction. So speculators are loading crude oil on rail cars and shipping it to Louisiana to capture that extra $14/barrel. Some are even storing it to sell at a higher price later (more on this below). You can also bet engineers are working overtime to reverse the flow of existing pipelines to take advantage of these extraordinary price differences.
Refineries are trying to take advantage of this situation as well.
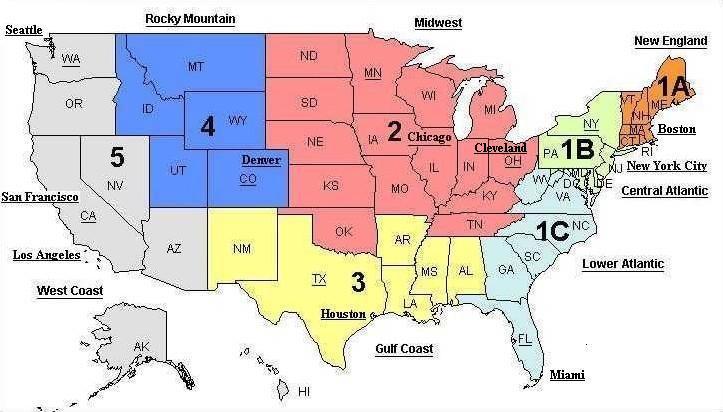
The United States is divided into five Petroleum Administration for Defense Districts, or PADDs. These were created during World War II under the Petroleum Administration for War to help organize the allocation of fuels derived from petroleum products. Today, these regions are still used.
<Click on graphic for larger image>
As the graphic above shows, Cushing Oklahoma is part of PADD2 which covers the plains and upper Midwest. So, Cushing inventories largely serve PADD2 refineries.
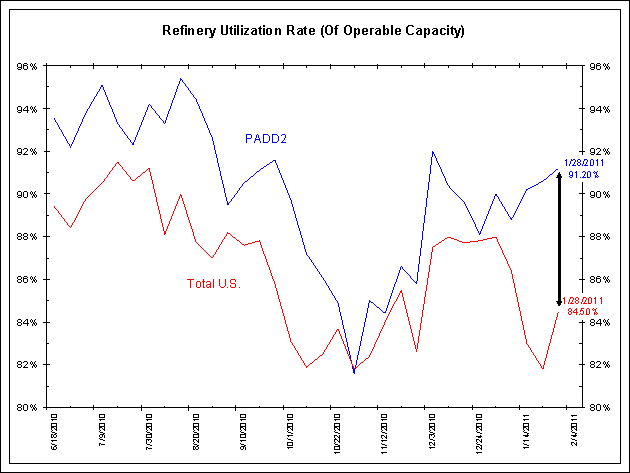
As the next chart shows, PADD2 refinery utilization is now running several percentage points above the rest of the country. PADD2 utilization is also rising as total U.S. refinery utilization is flat-to-lower. PADD2 refiners understand they are getting relatively cheap crude oil from Cushing Oklahoma and are cranking up capacity as fast as possible to take advantage of it.
<Click on chart for larger image>
Do All Benchmarks Converge At $100 or $87?
Over time the combination of speculators loading rail cars, reversing pipelines and refiners running at full capacity will even out Cushing Oklahoma prices with other world benchmark prices. This still might take several more months, but it will happen. So where does everything even out?
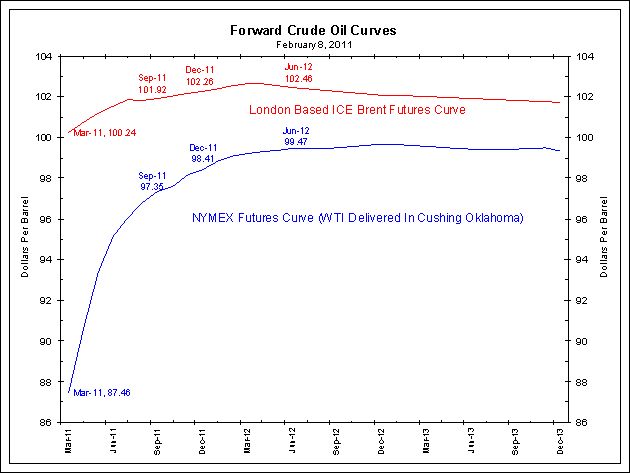
The next chart shows the forward curves for NYMEX Cushing delivered crude oil futures (blue) and ICE Brent futures (red). These two forward curves are very different.
NYMEX traders expect the price of Cushing-delivered crude oil to rise to around $97/barrel in six months (September) and approach $100/barrel by the summer of 2012. ICE Brent traders, on the other hand, expect prices to hold steady around $102/barrel through the end of 2013.
So, where do prices even out? The forward futures markets expect Cushing to rise to $100/barrel and align with Brent as the Cushing glut subsides.
This steep forward NYMEX curve, known as contango, also provides an incentive for speculators to buy and store crude now while selling deferred contracts, like September or December, to make delivery against. And indeed this is now happening in a big way.
<Click on chart for larger image>
Conclusion
Events are causing NYMEX futures contracts that are delivered in Cushing Oklahoma to be very unrepresentative of world crude oil prices. Cushing Oklahoma is a landlocked crude oil market served by pipelines. The new Keystone XL pipeline from Alberta Canada is coming online and causing a glut. As a consequence, Cushing delivered crude oil is trading as much as $14/barrel (16%) below other world benchmark crude oil prices. Speculators, engineers and refineries are rushing to take advantage of this situation.
Until the Cushing glut subsides, we must look at other world benchmarks like Brent to get a better gauge of world crude oil prices. When we do, we find energy prices look a lot like food prices as they have been rising smartly over the past few months and most measures are over $100/barrel. They are not trending sideways just under $90/barrel as the NYMEX futures market suggests.

