- Real-Time Economics (WSJ Blog) – Number of the Week: Companies’ Cash Hoard Grows.
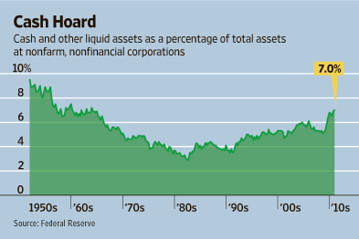
$1.9 trillion: Corporate America’s cash U.S. companies’ cash hoard keeps getting bigger, a trend both good and troubling. After hitting new highs in five of the last six quarters, nonfinancial corporations’ cash and other liquid assets reached $1.9 trillion at the end of 2010, according to the Federal Reserve. That’s 7% of all their assets, the highest level since 1963. On the bright side, the cash pile reflects the resilience of America’s companies and capital markets. Thanks in part to improved resource-management systems, executives have been able to act with lightning speed, slashing costs during the recession and hiring only as much as they need during the recovery — tactics that have generated record profits, if not jobs. Dynamic bond markets have allowed big companies to raise vast amounts of money even as banks have pulled back on lending. That has helped the U.S. avoid the kind of bankruptcy epidemic many had expected.
Comment
<Click on chart for larger image>
However, this must be compared to something. In the two charts below we compare liquid assets to total assets. Specifically, the data comes from table L-102 (Nonfarm Nonfinancial Corporate Business) of the Federal Reserve’s flow of funds accounts. Line 41 shows total cash of $1.89 trillion (chart above). Line 1 shows total assets, which was $14.24 trillion for a cash-to-asset ratio of 13.25%, not 7% as the story above says (chart at the top).
As the second chart below shows, cash to total assets of 13.25% is the highest since 1984, but this measure has been in a tight range for the last 25 years.
<Click on chart for larger image>
<Click on chart for larger image>
The chart at the top of this post shows The Wall Street Journal’s calculations. Instead of using total financial assets (table L-102), they use table B-102 which is a larger measure that not only includes all the $14.24 trillion of financial assets in table L-102 but also another $12.79 trillion in tangible assets for a total of $27.03 trillion in total assets. Dividing $1.89 trillion in liquid assets by $27.03 trillion in total assets yields a ratio of 7.0%, as shown at the top.
These tangible assets are largely real estate assets. Total assets are depressed, and the cash-to-asset ratio according to the Wall Street Journal measure is now at its highest level since 1963 because real estate prices are depressed, down $3 trillion in the last 3 years. This ratio could easily drop lower if real estate prices were to rebound, regardless of a company’s cash holdings.
We believe The Wall Street Journal is using the wrong measure. Their measure is driven by rising and falling real estate prices and not corporate decisions about holding cash. If one uses financial assets only, as we do above, the conclusion is cash levels are slightly elevated, but nothing extreme.
Why is this important? The mantra that there is “too much cash on the sidelines” is cited by almost every equity bull today. It seems as if asset allocation decisions are influenced by this mistaken belief. Congress is holding hearings on this topic and the administration is considering changing laws because they believe this to be the case.
For sometime now we have argued that cash on the sidelines is not abnormally high, disagreeing with stories such as the one above from the Wall Street Journal.
Nominal levels of liquid assets at nonfarm nonfinancial corporate businesses continue to expand to all-time highs. As of December 31, 2010 these assets stood at a record $1.89 trillion.