- The Financial Times – Modest expectations
Thursday sees the first estimate of US gross domestic product for the first quarter. So has the market followed the habits of the past year and overshot? Out of the last 12 monthly GDP reports, the market has overestimated six times, been spot-on four times and been positively surprised on only two occasions. In the six downside surprises, 10-year Treasuries rallied (stocks and the dollar being more likely to be moved by other factors) four times, pushing down yields on average by 6 basis points. Even spot-on readings have produced an average fall of nearly 3bp. The first report for any quarter has the biggest impact – and for these, bulls haven’t been happily surprised at all in the past year. Ten-year yields have fallen nearly 7bp on average.
Comment
<Click on chart for larger image>
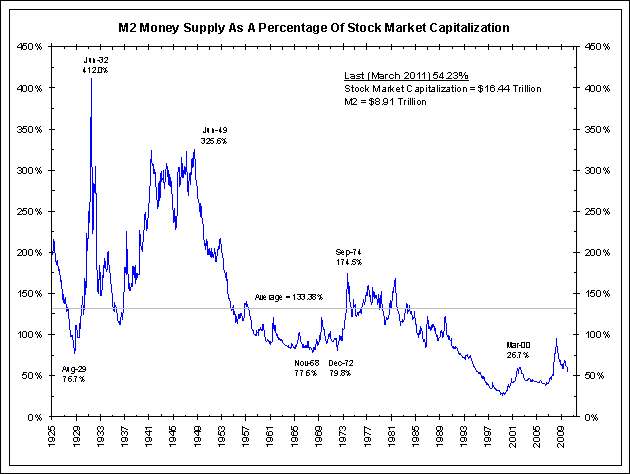
As of March 31, 2011 M2 as a percentage of stock market capitalization was 54.23% ($8.91 trillion divided by $16.44 trillion).
<Click on chart for larger image>
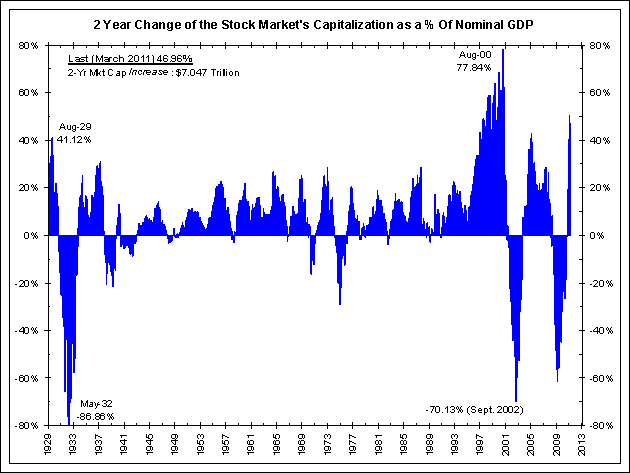
As of March 31, 2011 the two-year change in the stock market’s capitalization increased by $7.047 trillion or 46.96% of the size of nominal GDP.
<Click on chart for larger image>


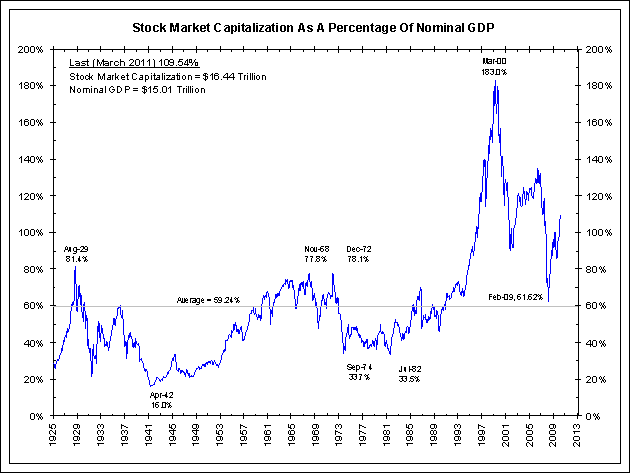
Today the Department of Commerce released GDP statistics for the first quarter of 2011. Below we highlight various measures of GDP, the stock market’s capitalization, and money supply. A complete list of our market capitalization charts can be found here.
As of March 31, 2011, stock market capitalization was 109.54% of nominal GDP ($16.44 trillion divided by $15.01 trillion).