Summary
Consumer trends and ETFs versus futures positioning are favoring a cheaper U.S. 10-year brought on by steepening at the front-end of the Treasury curve.
Comment
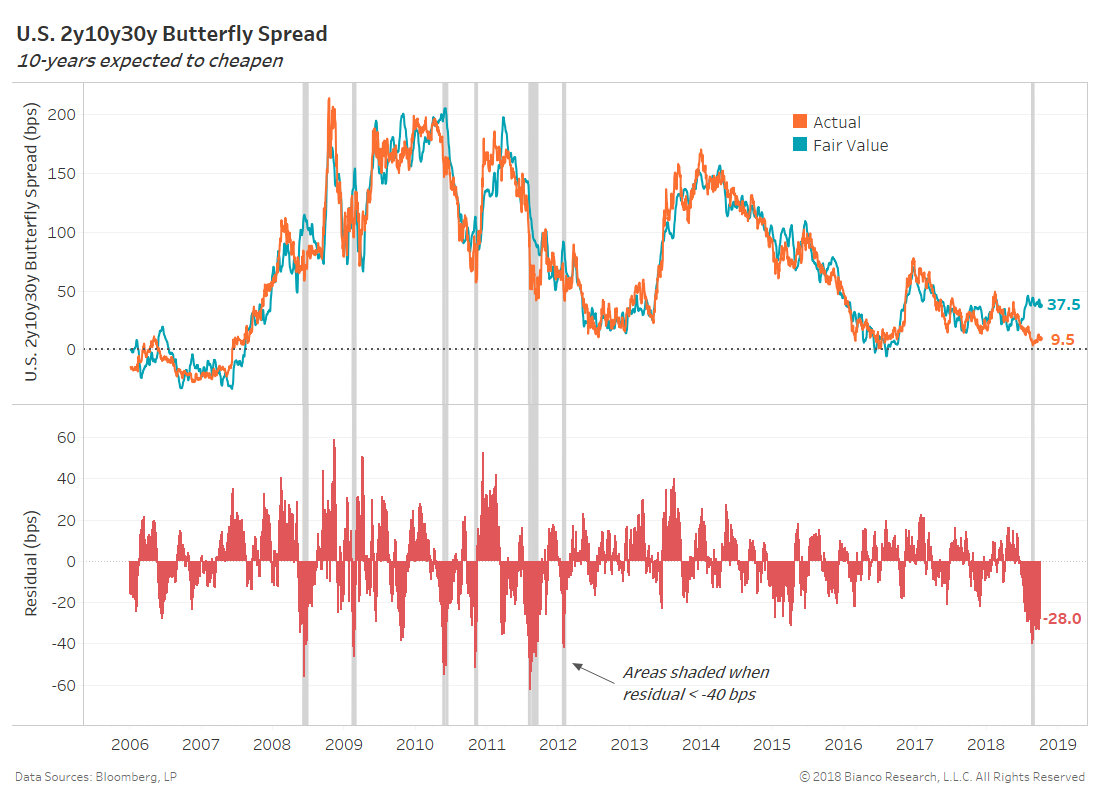
U.S. 10-years are ripe to cheapen on the Treasury curve following rising monetary policy uncertainty, slowing consumer credit, and a stable U.S. dollar. The chart below shows the U.S. 2y10y30y butterfly spread (9.5 bps) running 28 bps narrower than our fair value estimate (37.5 bps). U.S. 10-years have not been this rich since February 2012.
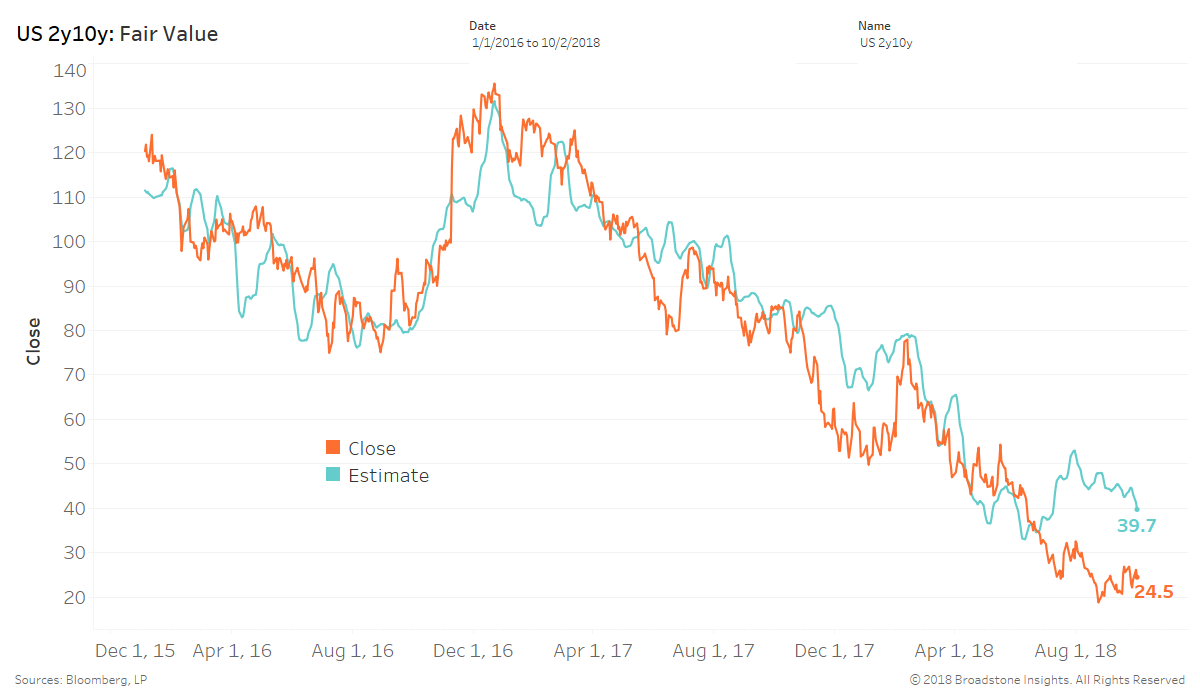
The next chart shows the U.S. 2-year 10-year spread leg of the butterfly, which resides nearly 15 bps flatter than our fair value estimate of 39.7 bps.
Our calls for the U.S. real 2-year 10-year spread (TIP) to come out of inversion came to fruition earlier this week.
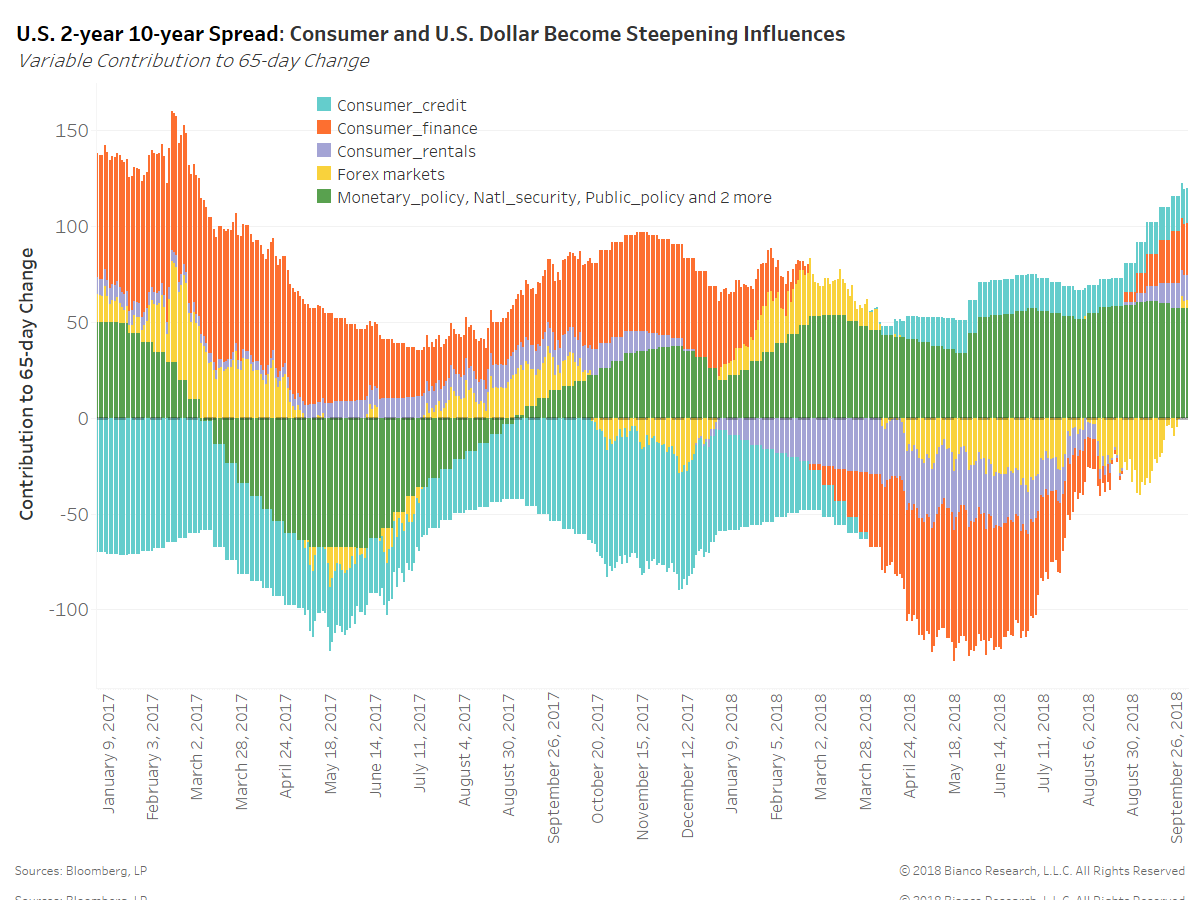
The contributions of key variables to our fair value estimates are shown below. Google search trends measuring consumer credit, finance, and rentals have all swung to a steepening bias. Modest risk-off flows have investors once again favoring the safety of short-term U.S. Treasuries or cash-equivalents.
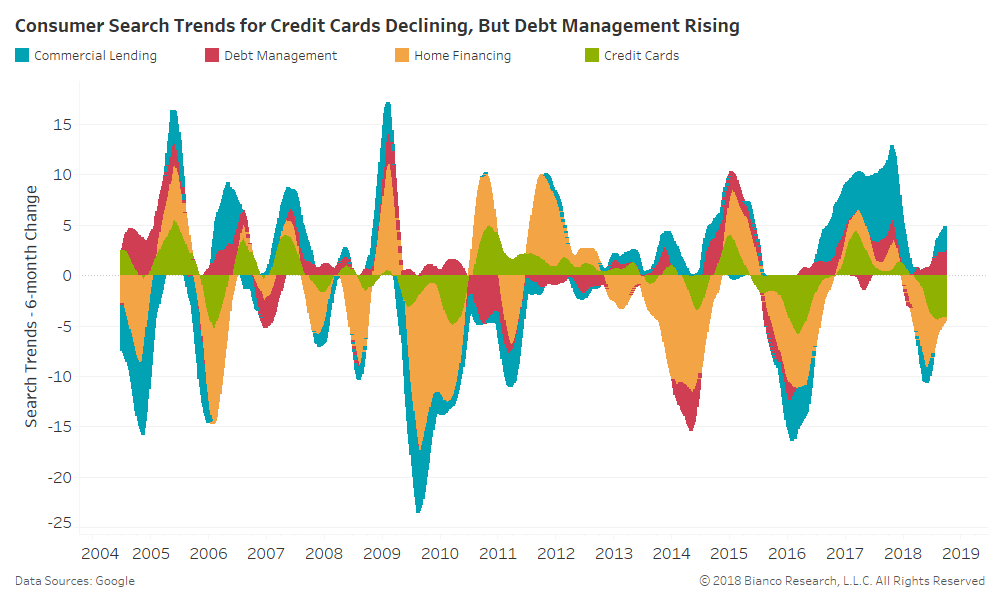
Google search trends for credit (six-month changes) are shown below. Consumers’ heavy use of credit cards have greatly subsided, while we are seeing an up-tick in debt management. Consumers are becoming cautious and not over-spending. Interest in home financing has slowed its descent, but has yet to turn positive.
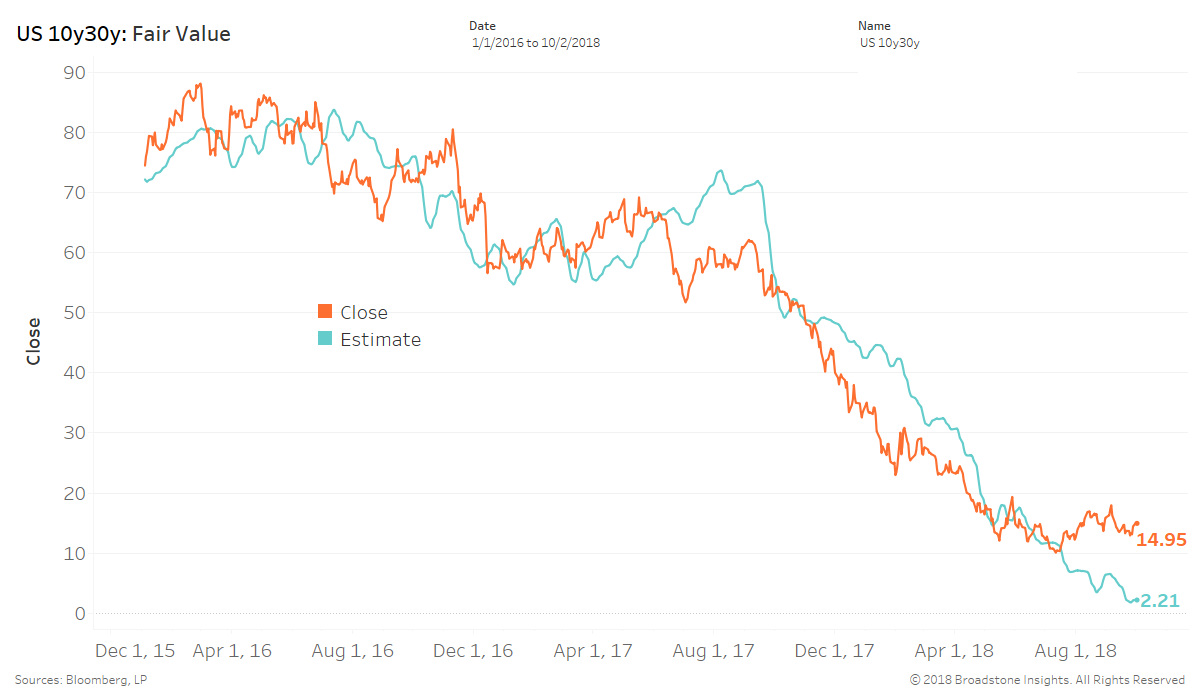
The next chart shows the U.S. 10-year 30-year spread leg of the butterfly, which resides nearly 12 bps steeper than our fair value estimate of 2.2 bps.
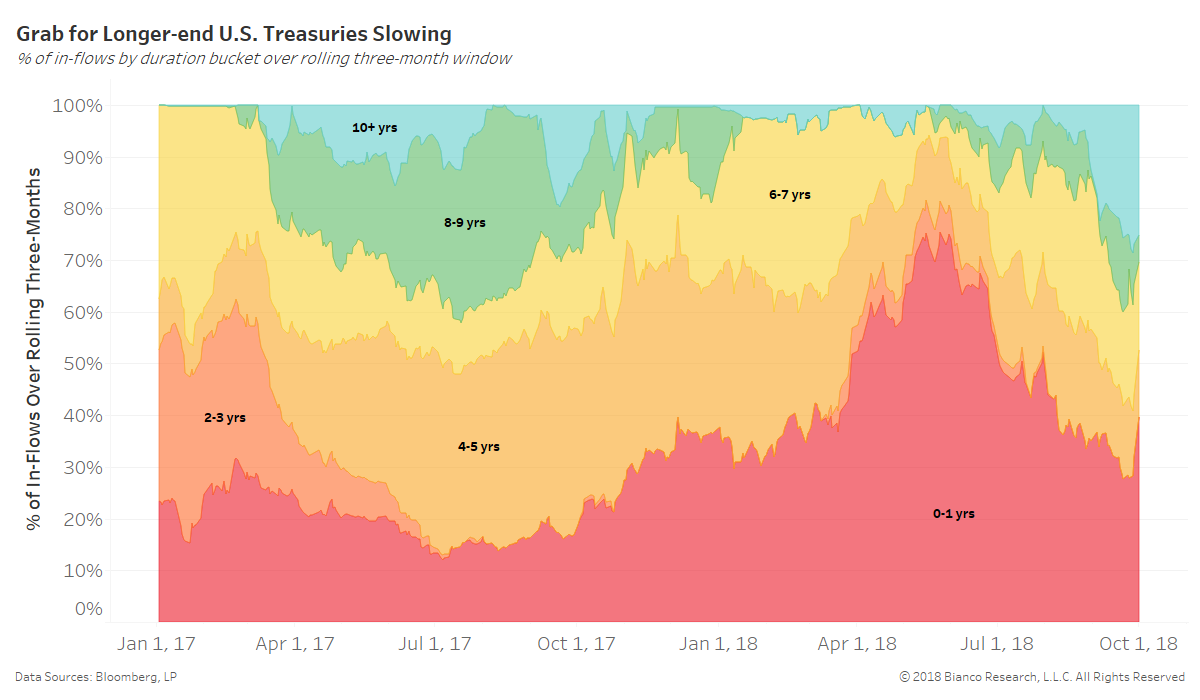
ETF investors had made a rush back into longer-duration beginning in late August 2018. But, investors are once again returning to shorter durations with greater than 50% of flows over the past three months going to 5-years or less.
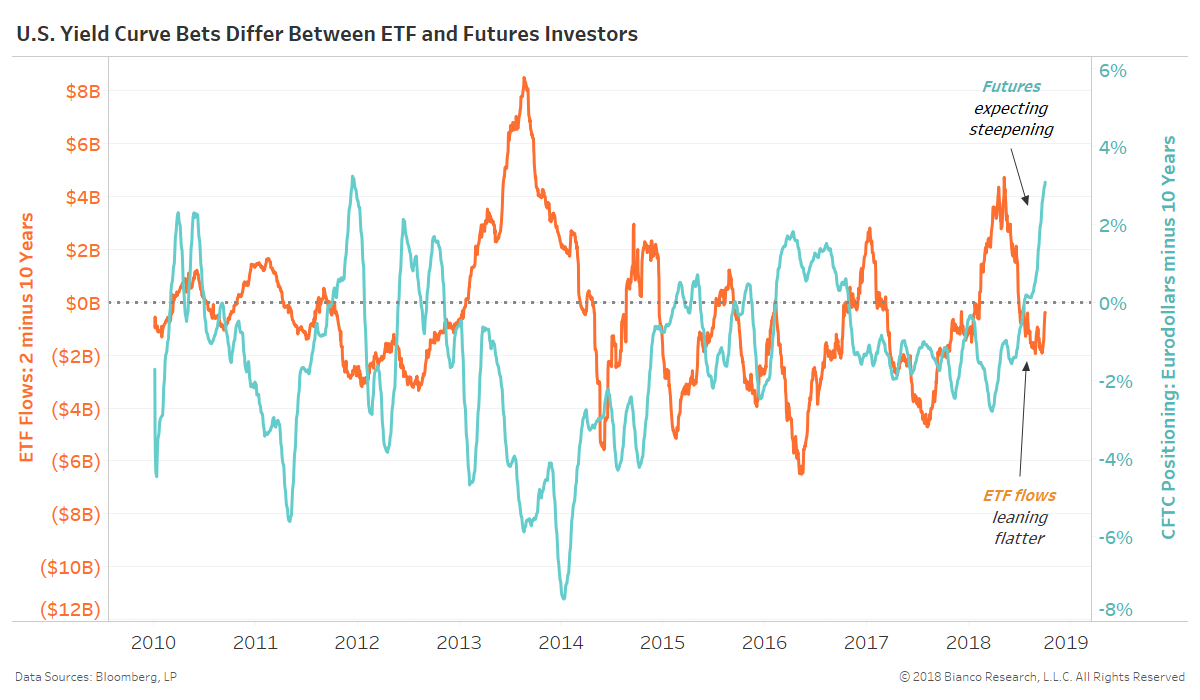
ETF investors have had a habit of being wrong on yield curve biases, while futures investors tend to lead. The last chart shows the duration-adjusted flows into yield curve flatteners by ETFs (orange, left-side) and futures (blue, right side). Higher, positive values indicate positioning for steepening, while lower, negative values indicate positioning for flattening.
- ETF positioning = Rolling three-month ETF flows for durations inside 2-years minus 6 to 10- years (duration weighted-spread).
- Futures positioning = Total net positioning as a percentage of open interest for eurodollars minus 10-years
Futures investors are becoming increasingly steepening-biased and ETF investors are moving toward balanced.

