- Barron’s – What Inflation Could Mean for the Market
Largely absent during the economy’s eight-year recovery from the financial crisis, inflation is on track to pick up in 2018—and it might just catch investors off-guard. For now, price pressures are benign, even as U.S. economic growth cruises into the new year at a 3% clip, with business-friendly tax cuts on the way. The core consumer price index, which strips out energy and food, was up just 1.7% year over year in November. Economists have raised the specter of inflation for several years, only to be disproved time and again. There’s reason to believe, however, that 2018 will be different—that prices will finally rise in a more sustained pattern, forcing stock- and bond-market investors to react to a new trend. “An unanticipated acceleration in inflation is probably the biggest risk for markets in 2018,” says Larry Hatheway, chief economist at GAM Investments and head of GAM Investment Solutions.
Summary
Comment
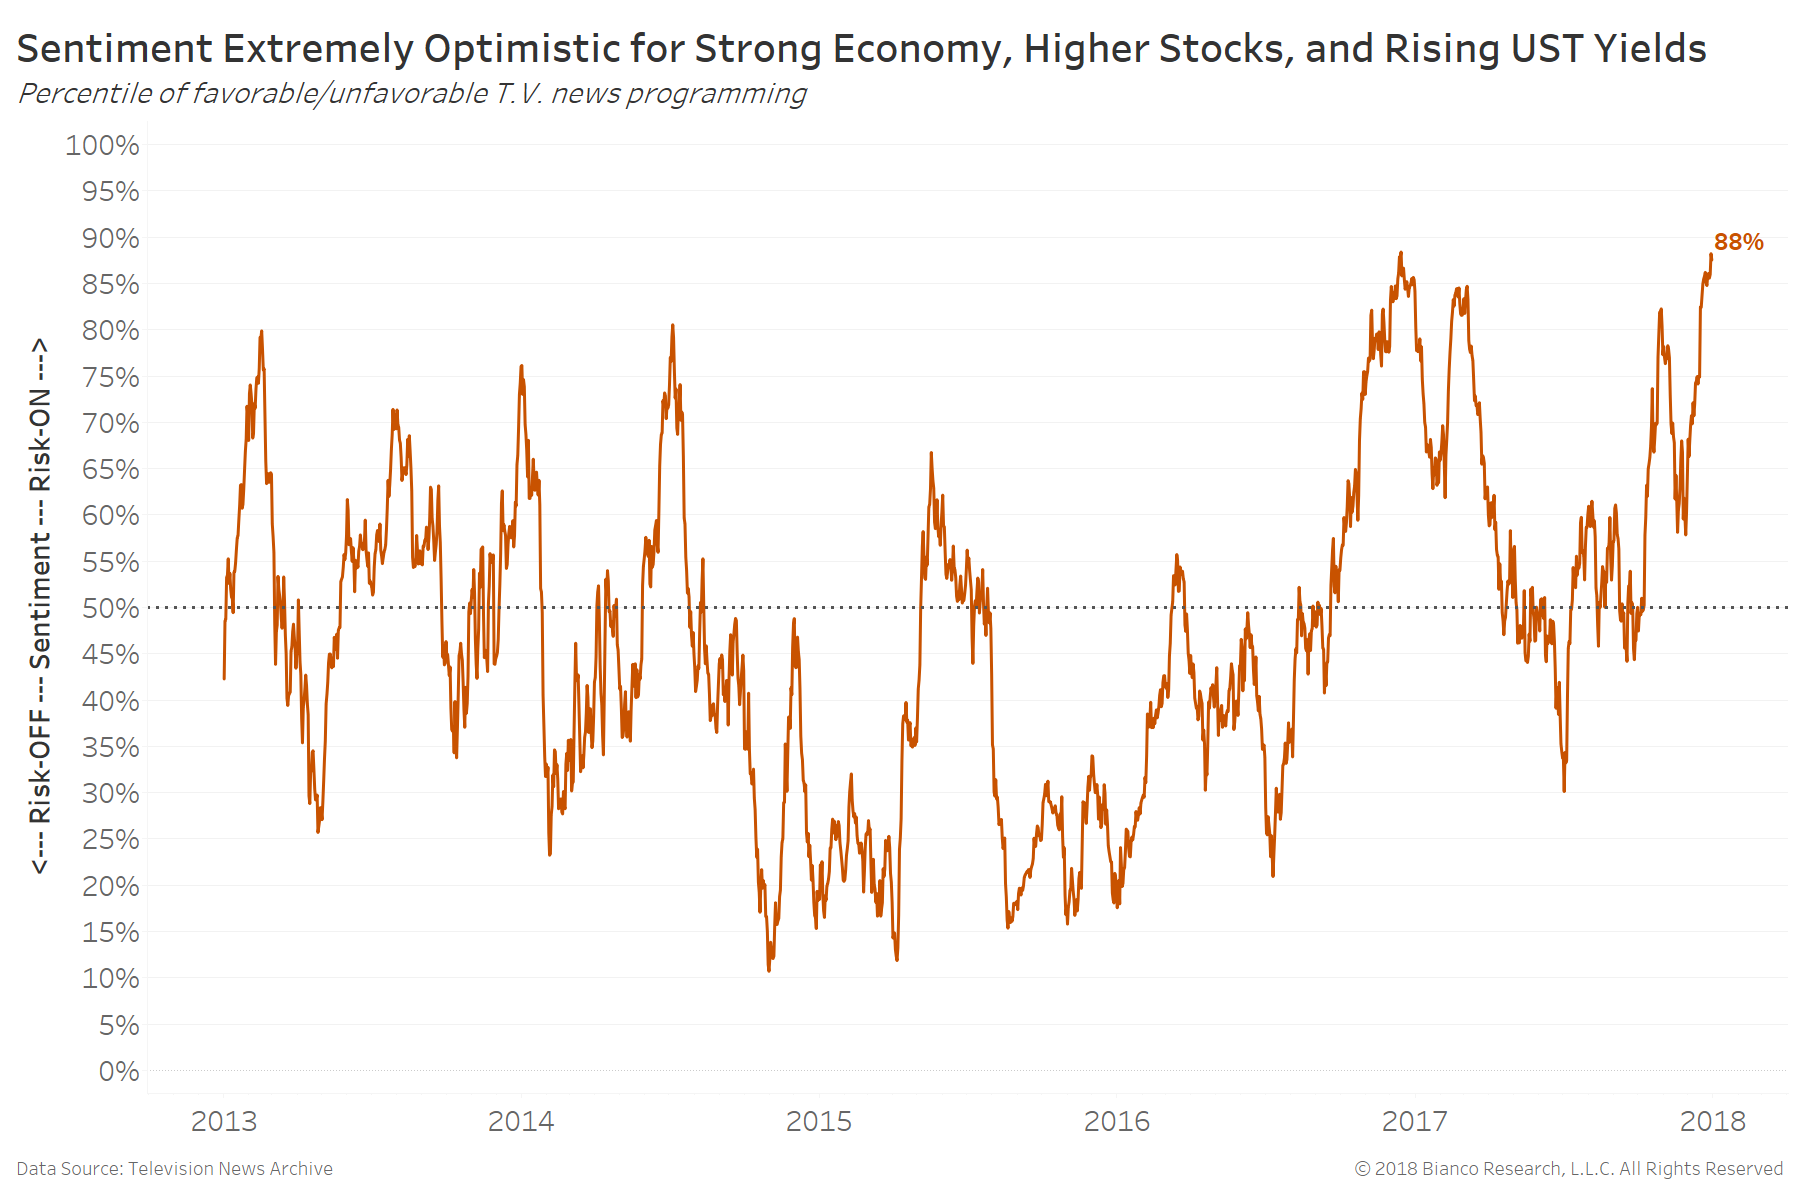
Financial T.V. news are again swelling with segments projecting higher inflation and volatility for the New Year. You only need wait ten to fifteen minutes to hear the greatest upside risks are more erratic returns and inflation, very similarly proclaimed to end 2016.
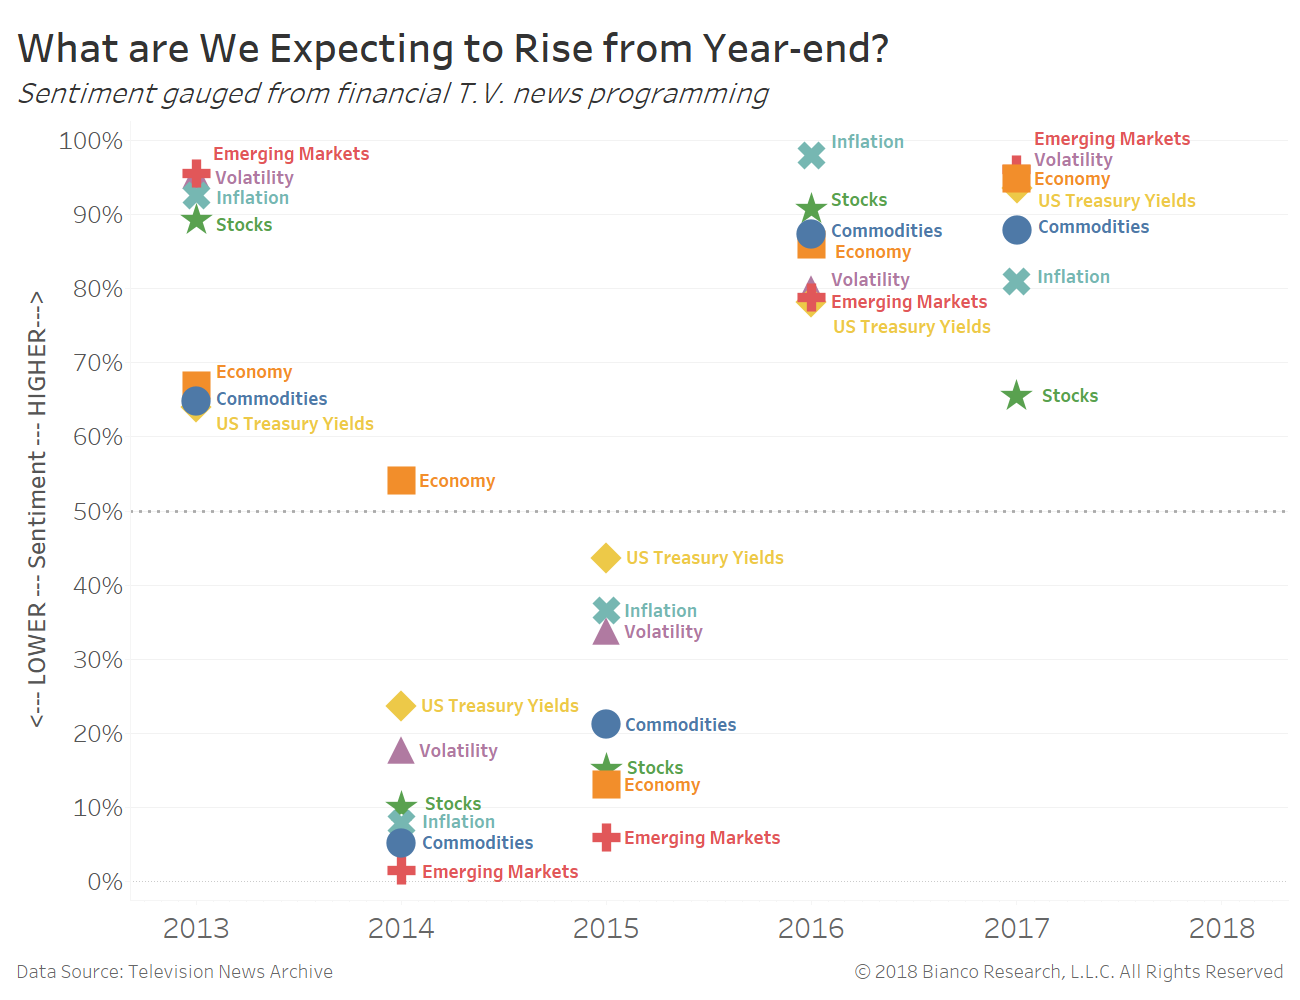
We compare sentiment in the analysis below for seven key economic measures during the final days of each year since 2013. Sentiment scores are percentiles (0-100%) of favorable-to-unfavorable commentary uttered on all programming across CNBC, Bloomberg, Fox Business, Fox News, MSNBC, and CNN. We believe comments made on major T.V. news are the first-cut reflection of investor, business, and consumer biases.
Higher percentiles in the chart below indicate a stronger consensus view the respective measure will rise. Investors are most optimistic about rising emerging markets (red) followed by volatility (purple), economic growth (orange), and U.S. treasury yields (yellow).
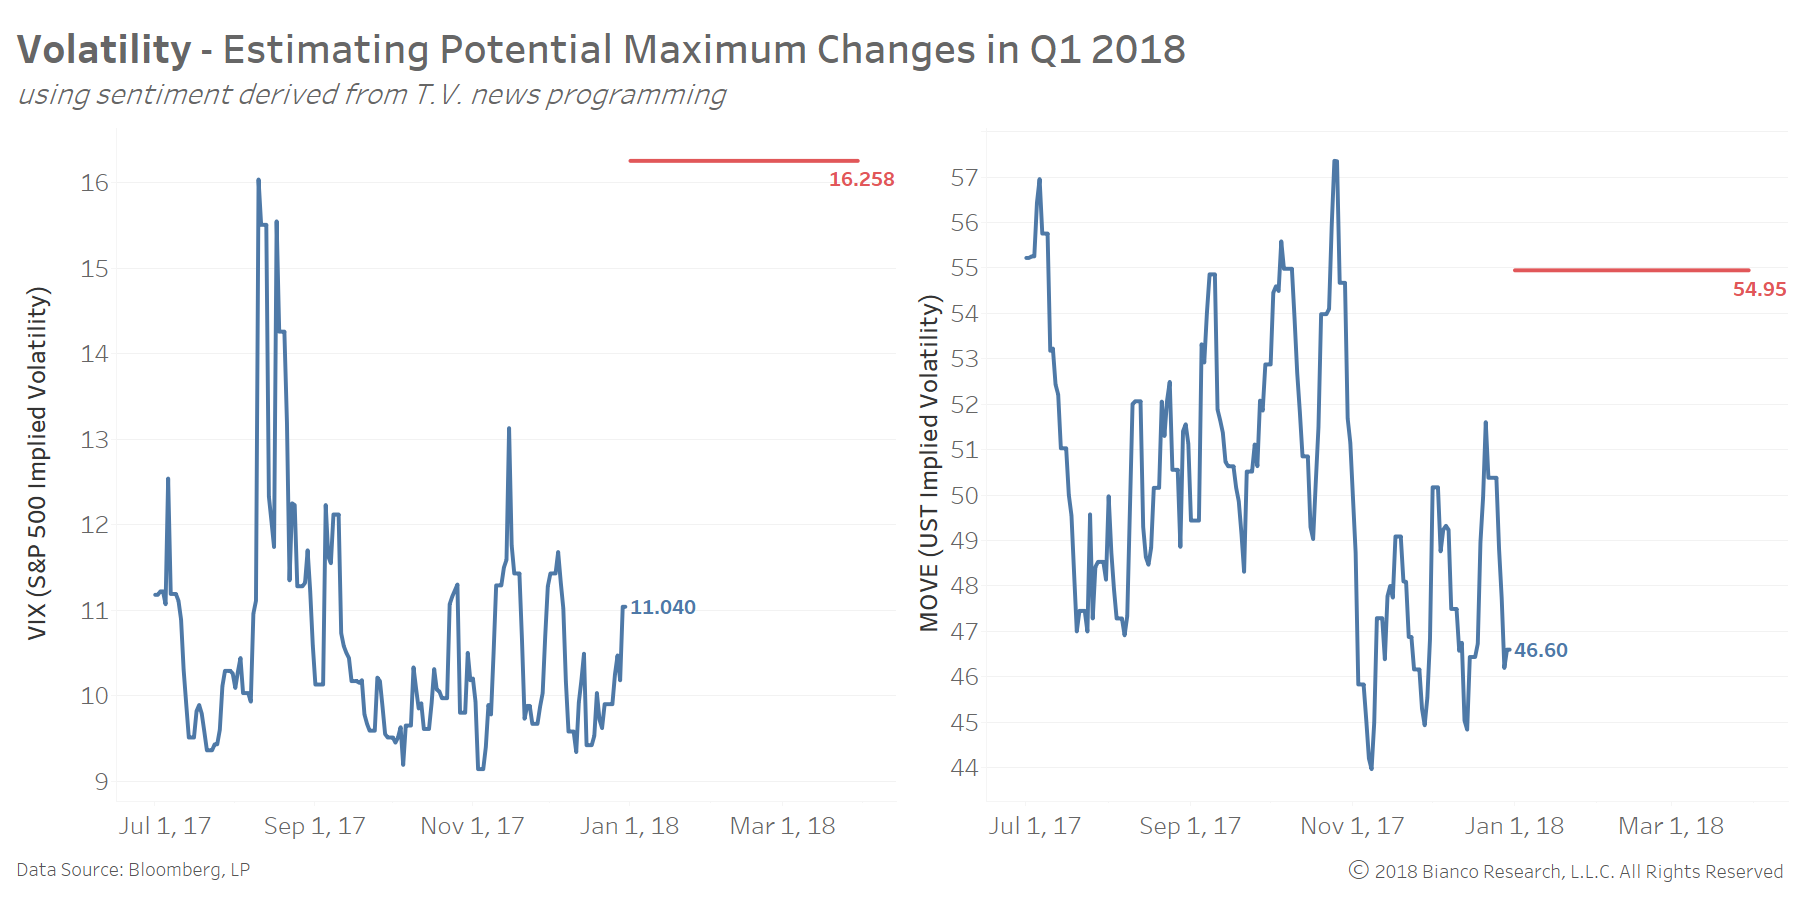
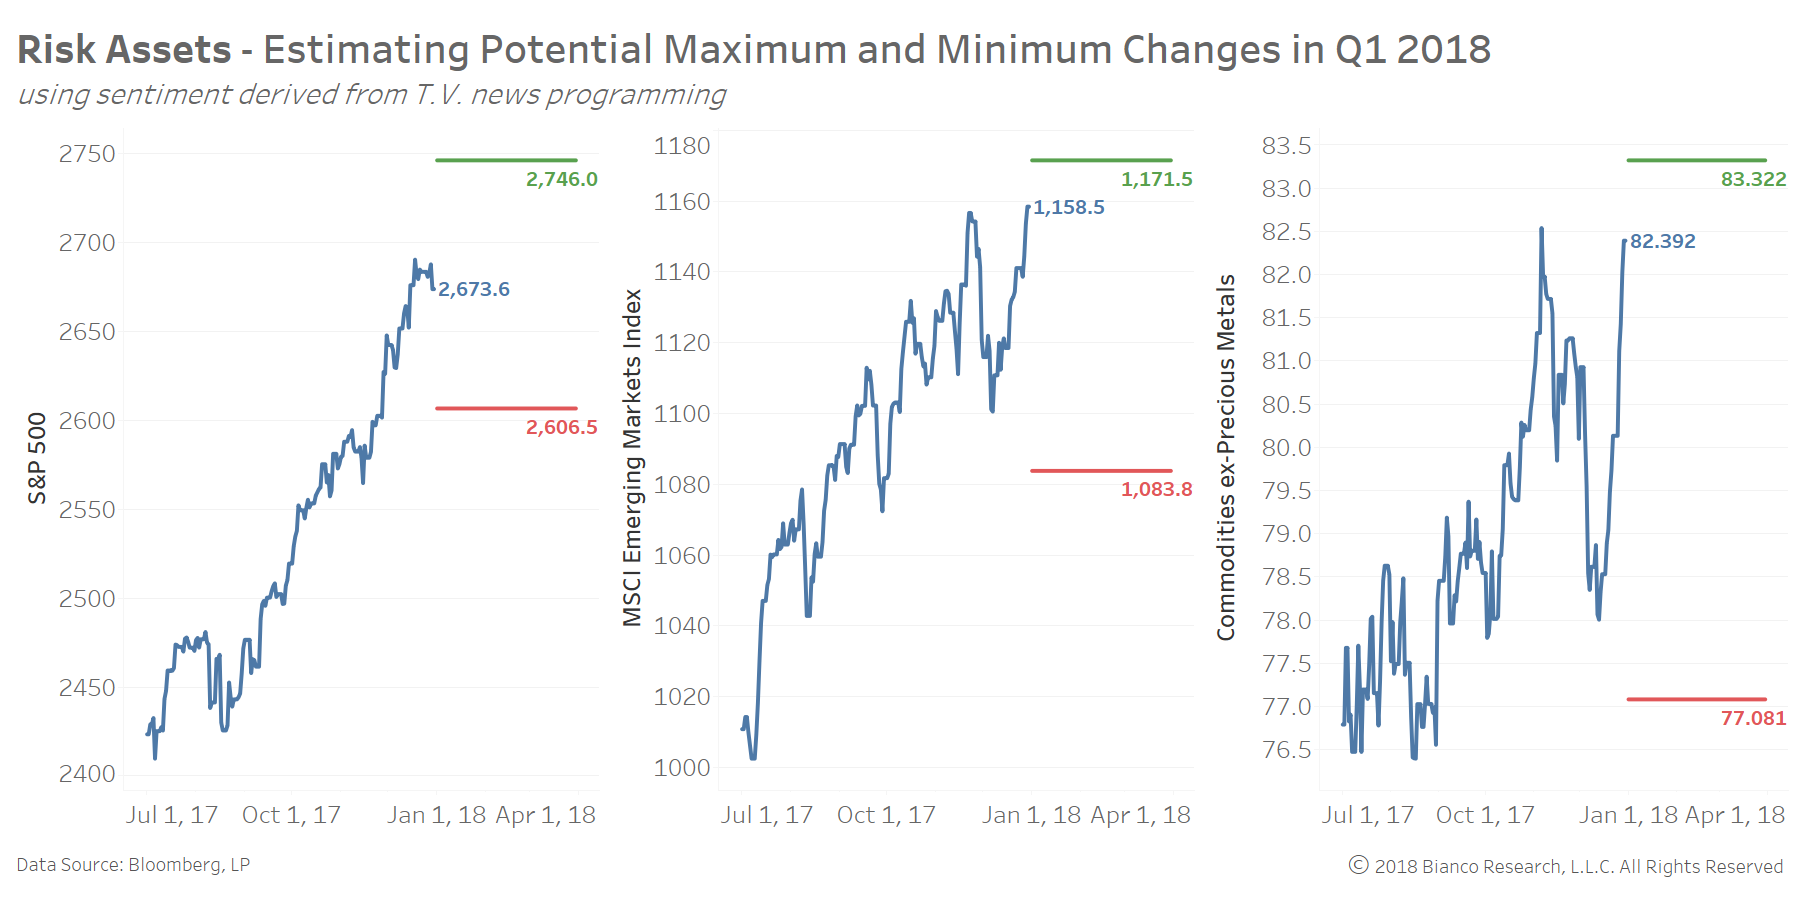
The degree of optimism across each economic measure are used to estimate maximum and minimum returns for Q1 2018. Basically, which market could see the biggest surprise?
The first set of charts show potential ranges for the S&P 500, MSCI Emerging Markets Index, and Commodities ex-precious metals. The outlook is balanced for the S&P 500, while heavily skewed to the downside for emerging markets and commodities. Will 2018 start with developed equities out-performing their previously red-hot emerging counterparts?
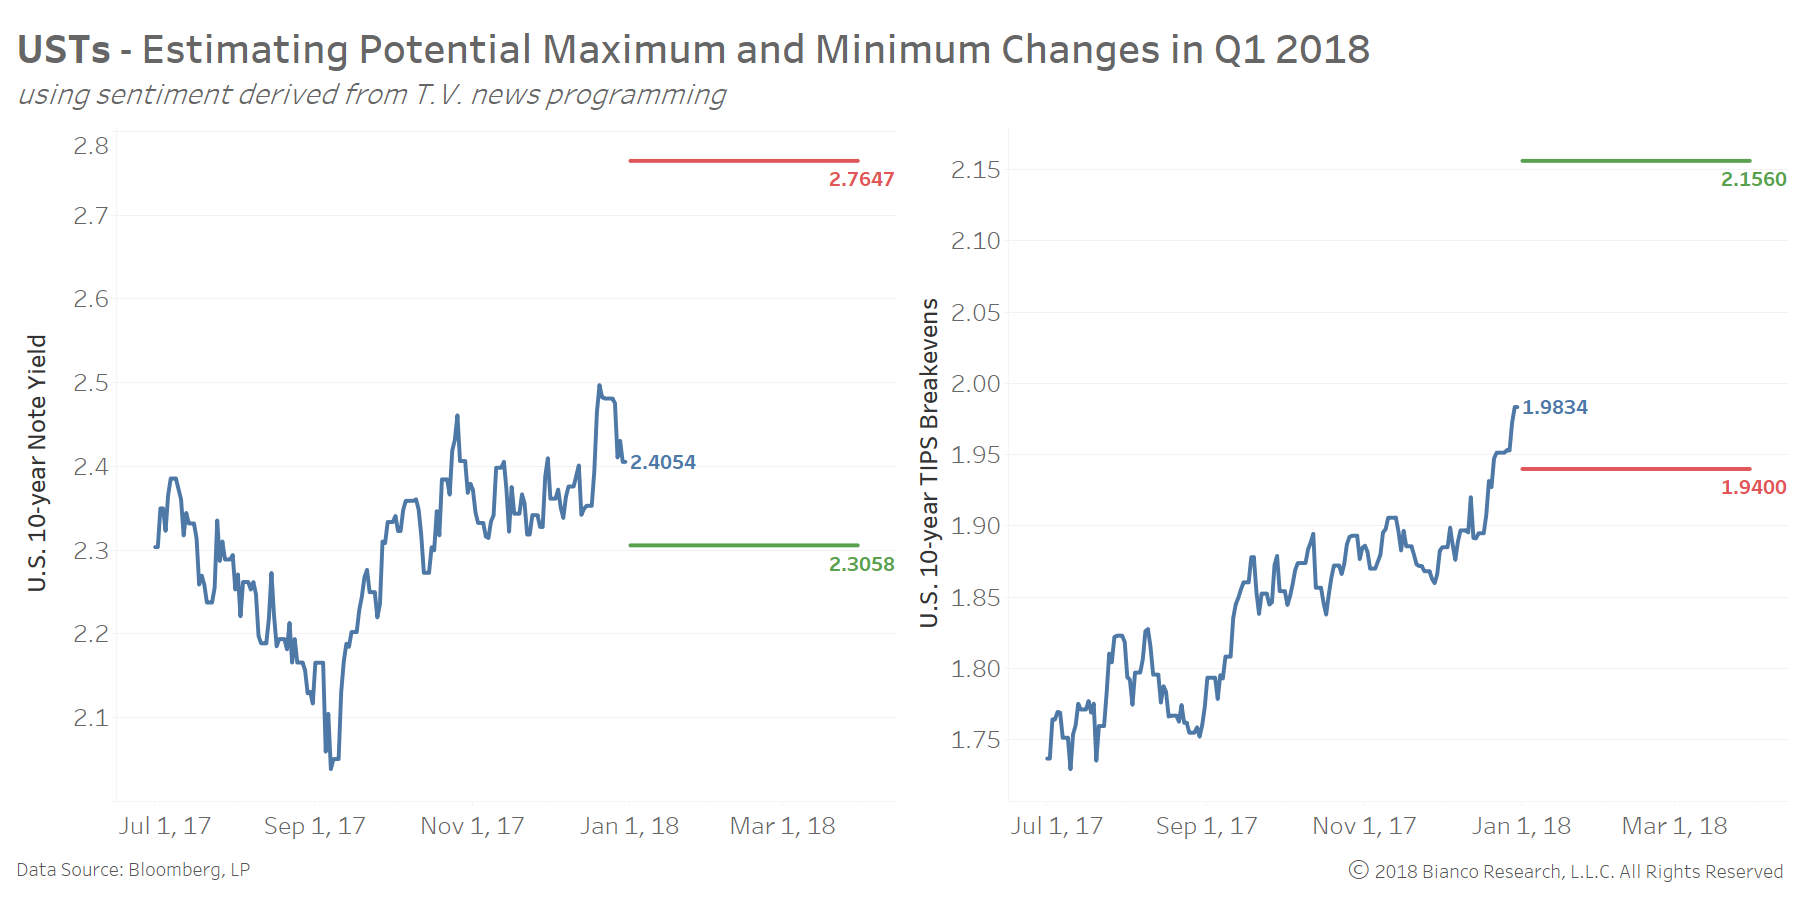
The next chart shows potential ranges in Q1 2018 for U.S. 10-year note yields and U.S. 10-year TIPS breakevens. Inflation expectations may ultimately be unfazed by overbought conditions for risk assets with a hefty tilt toward widening. Our modeling shows potential for 10-year breakevens to reach 216 bps from a current 198 bps.
Rising targets for inflation by options traders (i.e. inflation swap caps) may be the first signs of investors finally awaking from dreams of ‘no inflation forever.’ Last week we noted the ratio between inflation swap cap/floor premiums are finally breaking-out, favoring widening TIPS breakevens.