Comment
<Click on chart for larger image>
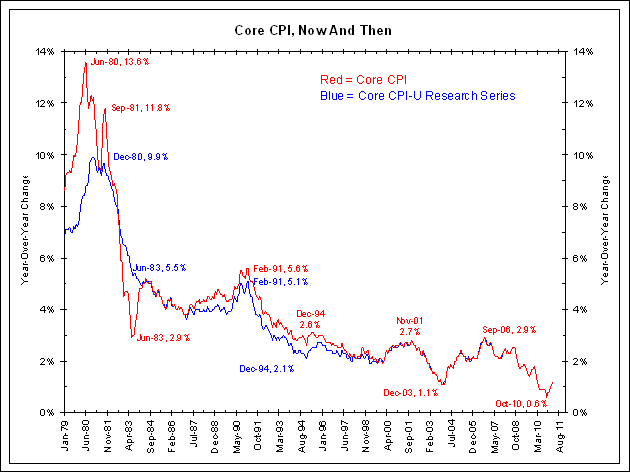
Below the same methodology is used to create a similar series for Core CPI. Again, if the current weights and methodologies used today were used in 1980, inflation would have been much lower. The Core CPI-U Research Series peaked at 9.9% in December 1980 as opposed to the regular Core CPI peak of 13.6% in June 1980.
<Click on chart for larger image>
1980’s Methodology Brought Forward
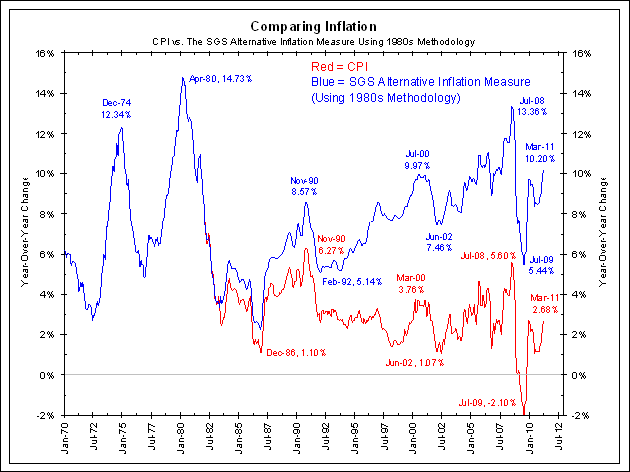
But what if we wanted to know what the inflation rate would be today based on the index rules used in the past? To get this answer, we must turn to Shadow Government Statistics. This website, run by economist John Williams, calculates CPI using the same methodology used in 1980.
As Williams explained in his October 2005 newsletter:
By stripping current CPI reporting of all the methodological shenanigans of the last three decades that were aimed at artificially reducing reported inflation, one might expect that the resulting series would match the proposed SGS Standard CPI fairly closely. While the patterns of annual growth tend to match reasonably well, annual inflation rates appears to trend somewhat higher for the SGS Standard series than the cleansed CPI series, as had been suggested by some subscribers. The reasons for this will be discussed next month, but the differences appear to be tied largely to BLS misestimates of the impact of some of its methodological changes over time.
Based on detailed BLS estimates of the impact of its methodological changes over time, published in the Monthly Labor Review, June 1999 (“Consumer Price Index research series using current methods, 1978-98,” by Kenneth J. Stewart and Stephen B. Reed), SGS has reworked the CPI-U series to remove the impact of the various methodological changes. The following two graphs show the results of that analysis.
<Click on chart for larger image>
<http://www.shadowstats.com/alternate_data/inflation-charts>
A growing divide exists between the level of inflation based on the 1980’s methodology and that of the currently reported inflation measure. The adjustments and revisions made to CPI throughout the years have largely resulted in lower rates of inflation being reported. As a result, a 2% to 3% year-over-year change in inflation, which sounded tame in 1980, could be problematic today.


In the last 30 years, there have been a number of changes in the calculation of CPI:
1981
1983
1987
1990s
1998
1999
2002
2003
2007
For those interested, the complete list of changes can be found on pages 8-11 of this PDF.
Today’s Methodology Through Time
Because this index has morphed so many times throughout the years, one complaint often lodged against the BLS is that inflation rates today cannot be compared to inflation rates from, say, 1980. In an attempt to offer a more apples-to-apples comparison of historical inflation, the BLS maintains a series known as the CPI-U Research Series. It reverse engineers the CPI based on today’s index weights and methodology all the way back to 1978.
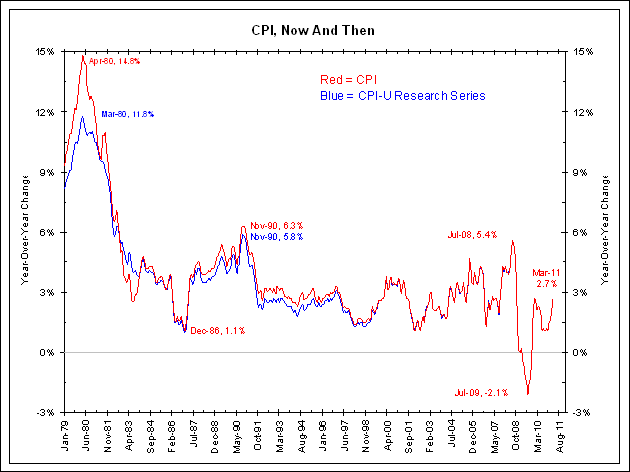
The chart below shows the CPI-U Research Series in blue and the normal measure of headline CPI in red. Because the last major revision to CPI occurred in 2007, these two measures only materially differ prior to that. If the BLS would have used the current index weights and calculations back in 1980, CPI would have peaked at 11.8% as opposed to 14.8%. So, according to this measure, the current construction of CPI favors lower inflation rates.