- The Financial Times – Inflation threat gnaws away at bond investors
Big danger for markets is what this could mean for interest rates and yields
Chetan Ahya, co-head of economics at Morgan Stanley, points out that headline inflation rates in the big developed economies, as well as China, were on average running 1 per cent below the long-term average by the end of 2015. Fast forward to the end of last year and that gap had narrowed to 0.1 per cent, and Mr Ahya forecasts that global inflation will this year end up 0.3 per cent higher than the long-term average.While higher inflation might, in the short run, be positive for record-breaking stock markets — with wage pressures still modest, greater pricing power for companies should juice profit margins — ultimately it poses a threat to earnings if wage rises become broad based.
Summary
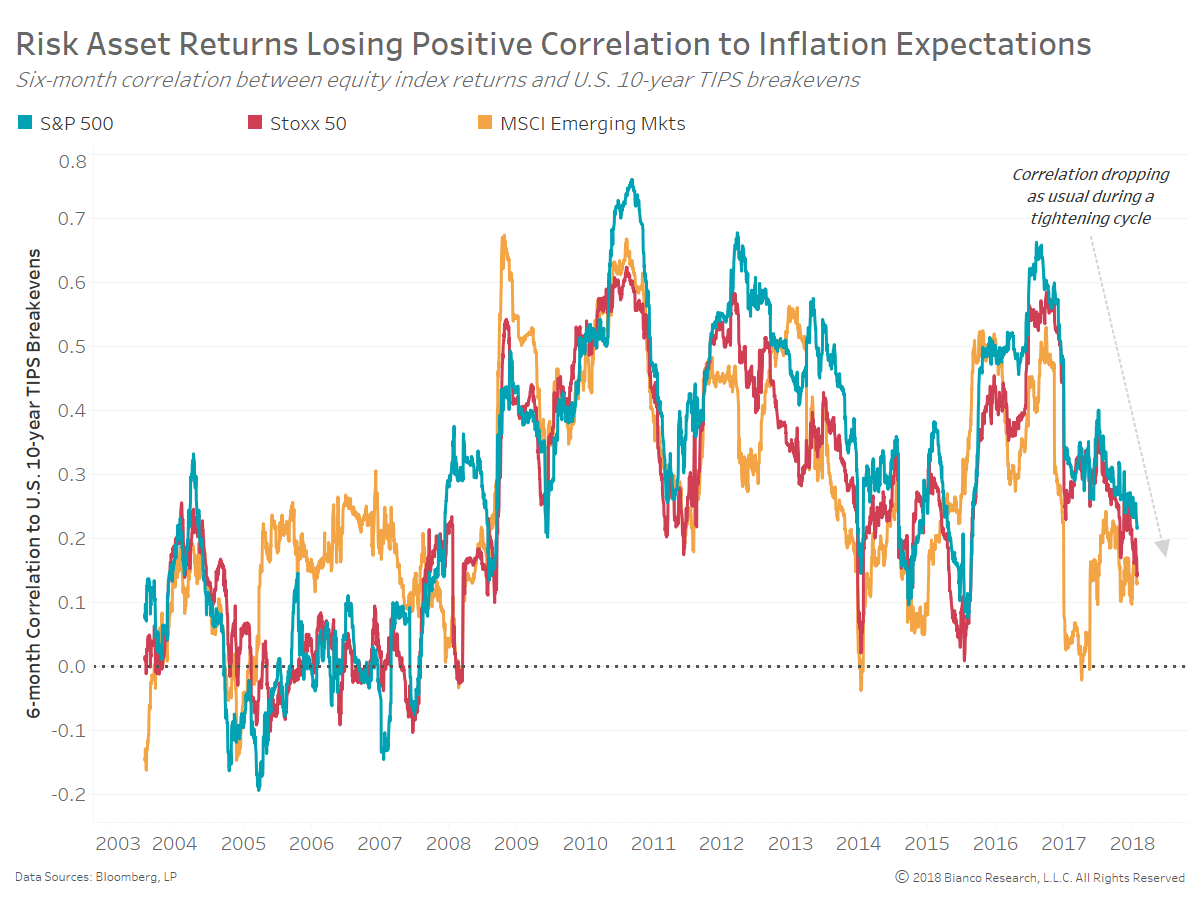
- Low Inflation No Longer a Boost to Equity Markets
- U.S. and German 2y10y Spreads Look Ready to Converge
- TIPS Breakeven Curve Ready to Steepen
- U.S. 10-year Yields Get a Divorce from the Japanese Yen
Comment
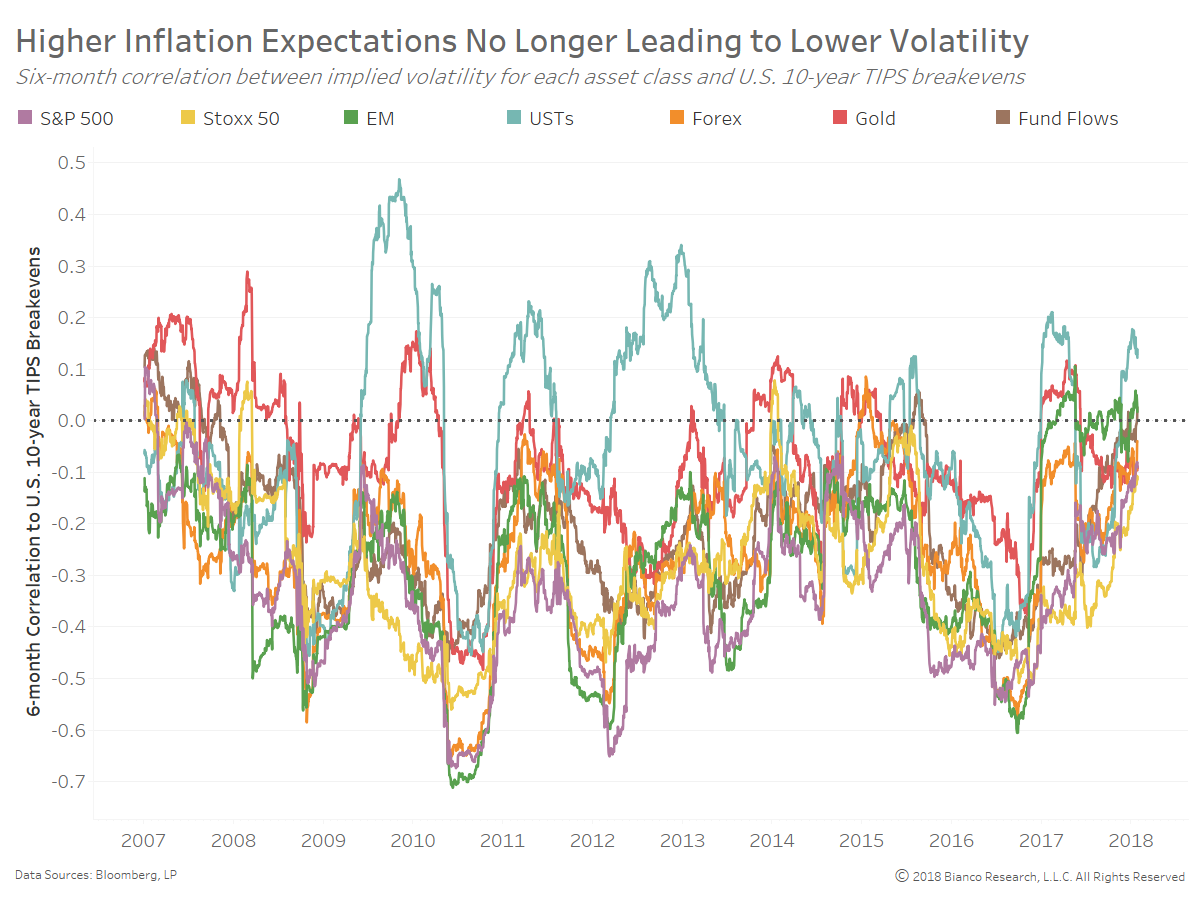
The chart below shows the six-month correlation between implied volatility by asset class and U.S. 10-year TIPS breakevens. Equities, U.S. Treasuries, and foreign exchange volatility are seeing a swift end to their negative correlation to inflation expectations.
We have heard this song before, namely in 2014 and 2015. However this time appears at least moderately different with market volatility seeing correlations shift relative to more pure measures of inflation like swap caps/floors and aggregate changes in breakevens across the globe.
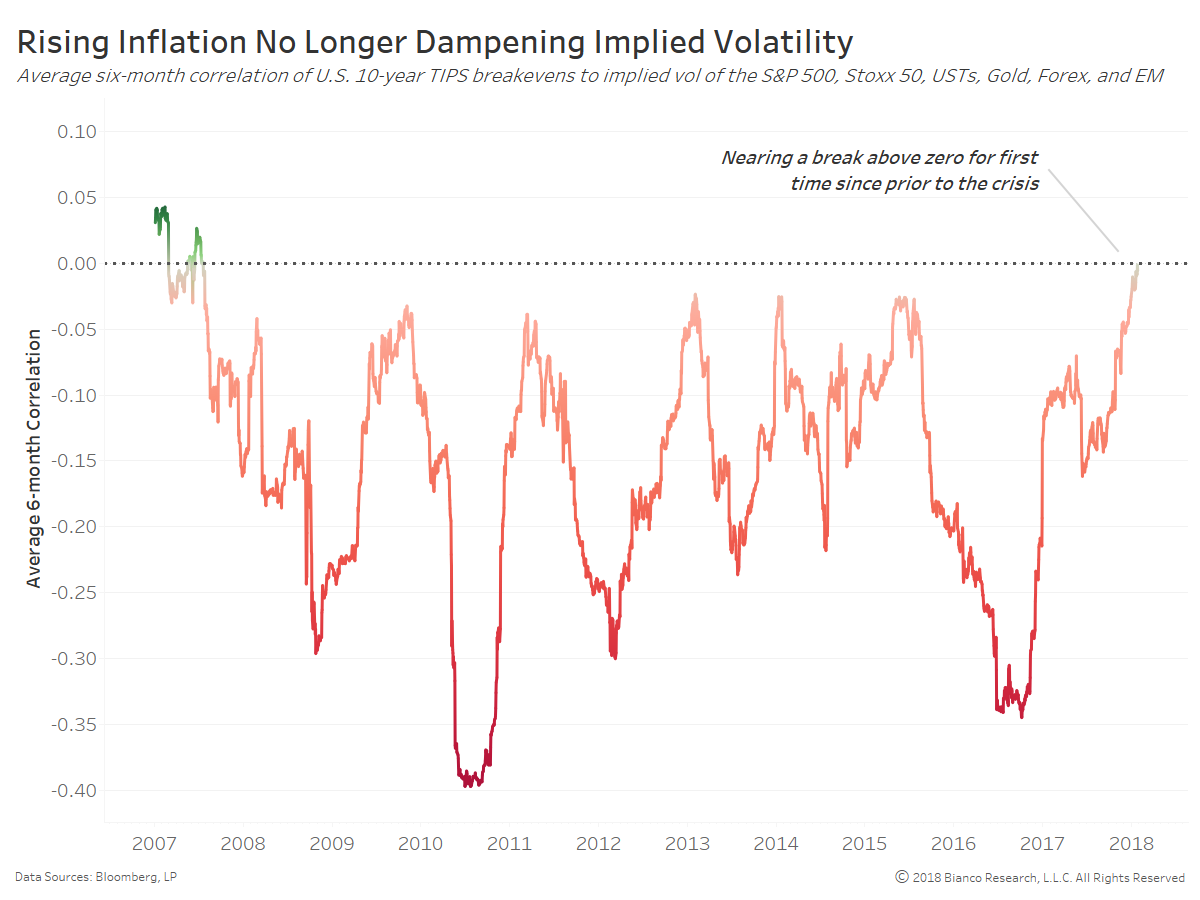
Whether or not volatility becomes positively correlated to inflation expectations will have major implications moving forward. A return to the negative correlations seen for the past decade would continue business as usual, but a positive shift would be a game-changer.
The next chart provides an average of the correlations shown above, which has failed to reach positive territory since July 2007. The latest average correlation of volatility to inflation expectations has risen to zero, threatening a likely end to the prospects of rising inflation providing a dampening impact on volatility.
Since the financial crisis, improved growth and inflation data have helped promote higher equity prices and lower risks/volatility. But, every tightening cycle since the 1980s has seen equity volatility (e.g. VIX) become quite positively correlated to inflation. In other words, inflation becomes a major problem and headwind for risk assets.
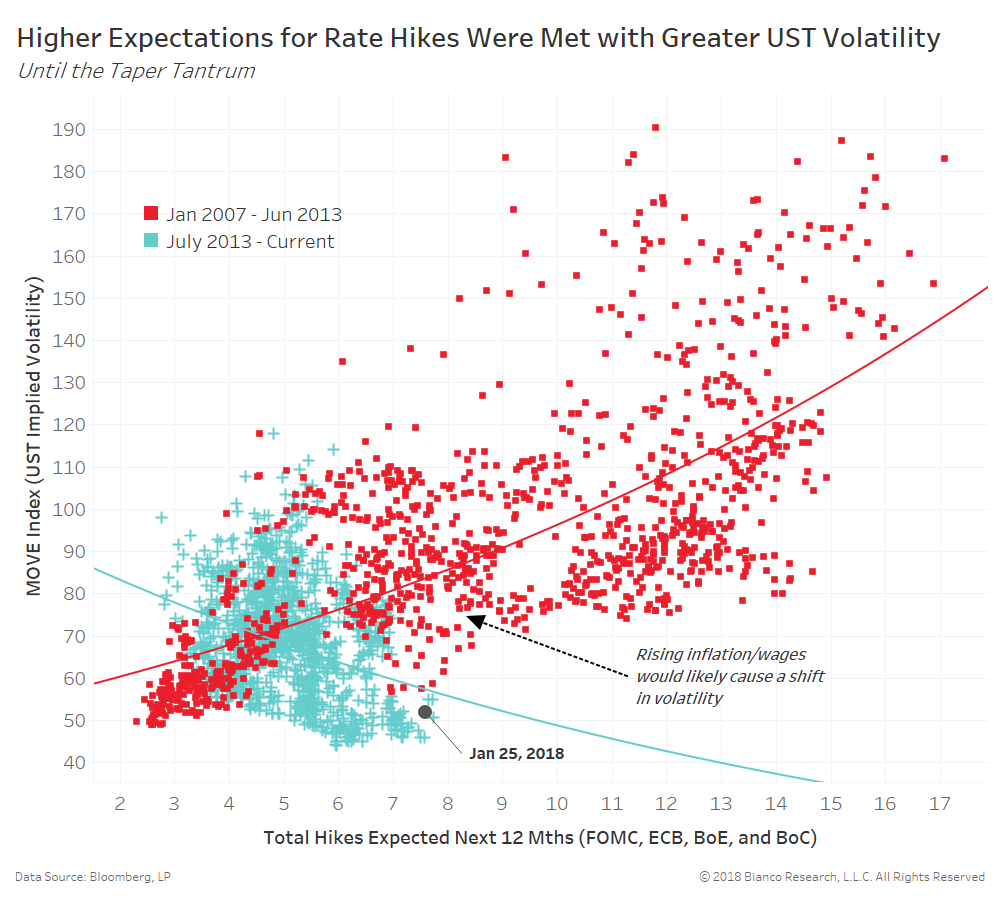
Market volatility is a product of economic growth, inflation, and central bank expectations. Rising inflation would of course instigate volatility, but so would increasingly hawkish central banks.
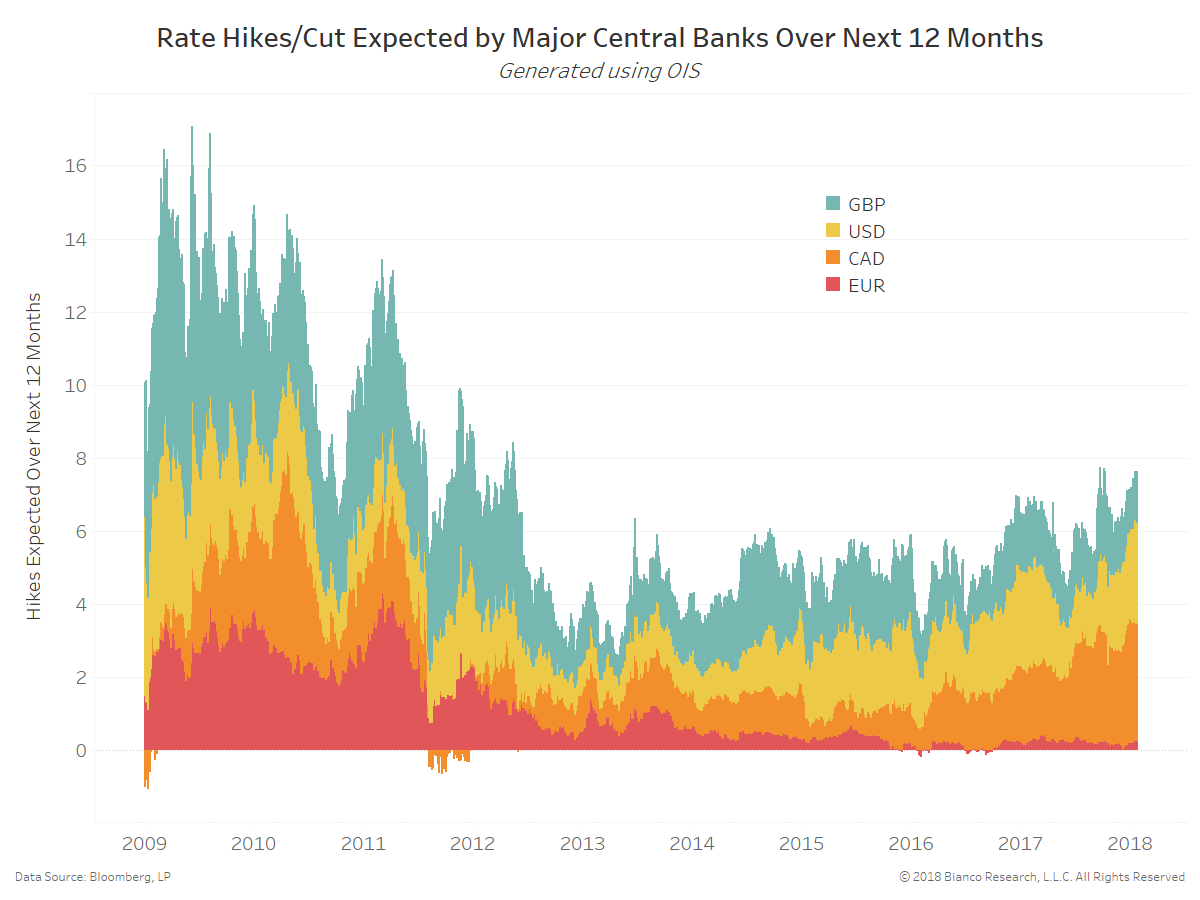
The next chart shows the total number of hikes expected over the twelve months ahead by the FOMC, ECB, BoE, and BoC. These central banks are nearing a total of eight expected hikes, which would be the highest since May 2012.
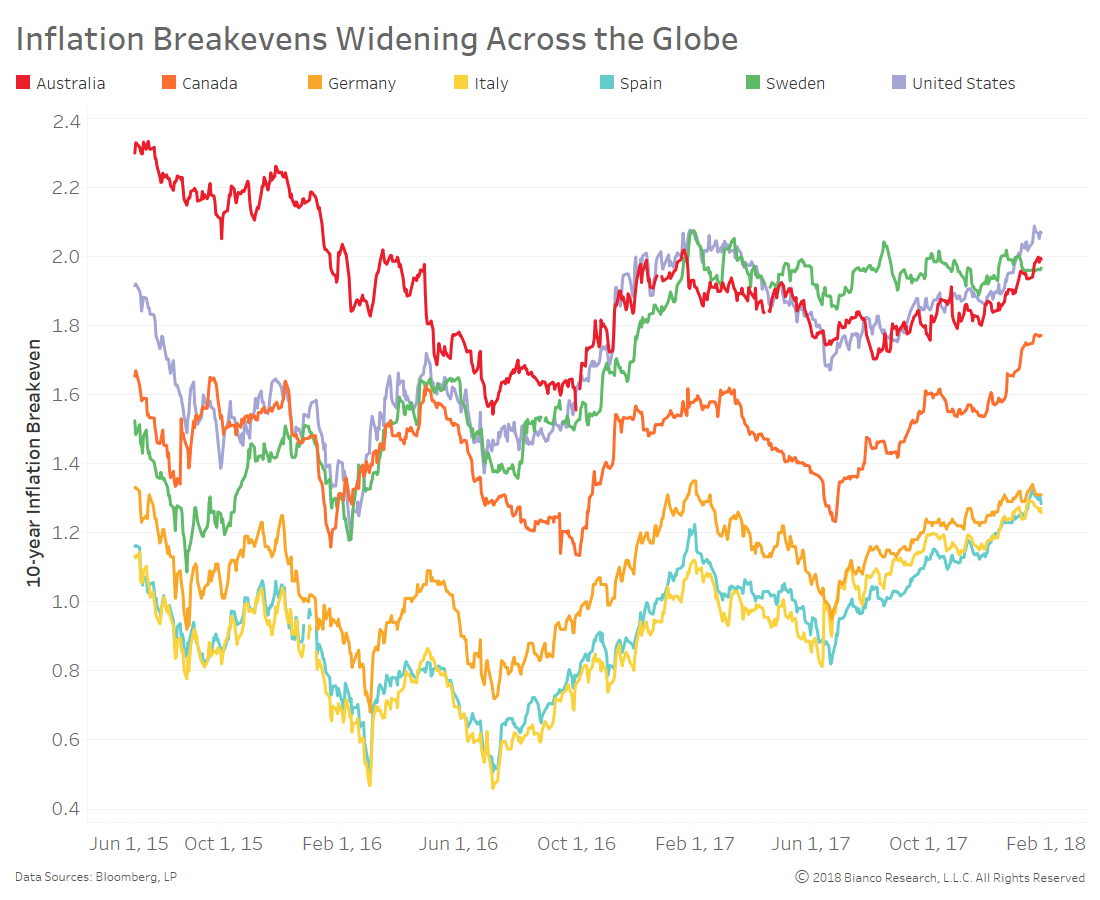
Bubbles are increasingly floating to the surface indicating an awakening of a beast not seen in over a decade. Investor flows into TIPS ETFs, rebounding demand for options on inflation (i.e. caps), and an end to the negative correlation between equity volatility and inflation expectations are providing a loud signal of potential inflation.
The links below provide many of these indications investors are becoming more fearful of inflation: