- The Financial Times – WTI oil prices fall below $50 for first time since December
Oil is slipping after data from the US revealed the country’s oil stockpiles hit an all-time record in February – rising for the ninth consecutive month and sparking fresh concerns about the extent of a global supply glut.The news sent prices slumping as much as 6 per cent on Wednesday with the sell-off extending into this morning. - Bloomberg – Commodities Battered by Signs There’s Still Too Much Supply
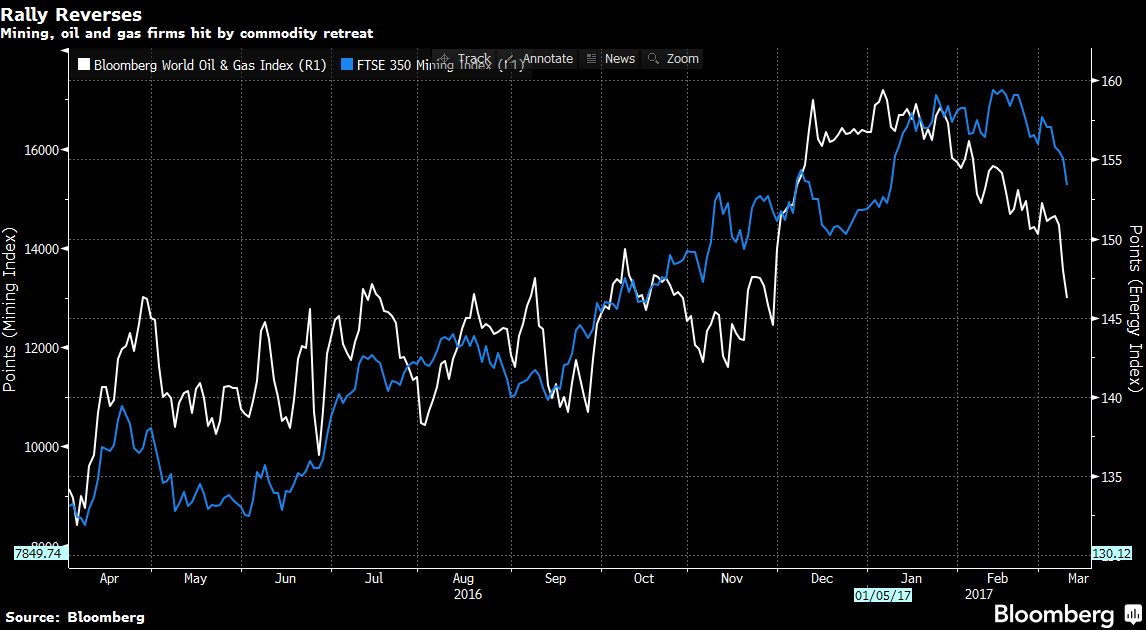
Raw materials head for biggest weekly drop since November
Once again, the biggest problem in commodity markets is too much supply.After a big rally in the past year, prices are starting to falter. Copper, often referred to as having an economics Ph.D for its ability to track the economy’s health, slid as stockpiles tracked by the world’s biggest metals exchange jumped by two-thirds. Record U.S. crude inventories have pushed down oil prices, while gold’s taking a hit as the Federal Reserve looks certain to raise borrowing costs next week.
Comment
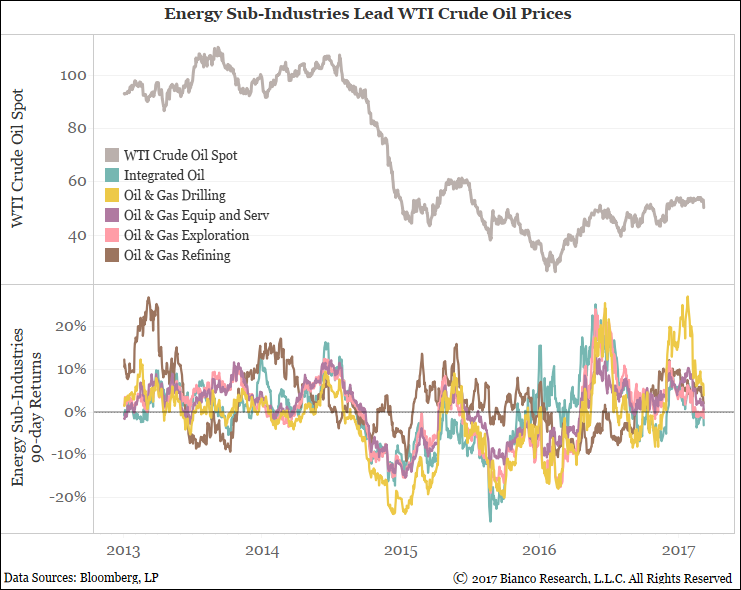
The chart below shows WTI crude oil in the top panel and 90-day rolling returns for five of energy’s main sub-industries found in the S&P 1500. They range from oil exploration to refining.
These sub-industries of energy peaked mid-January while WTI crude oil stalled in one of its tightest trading ranges in history.
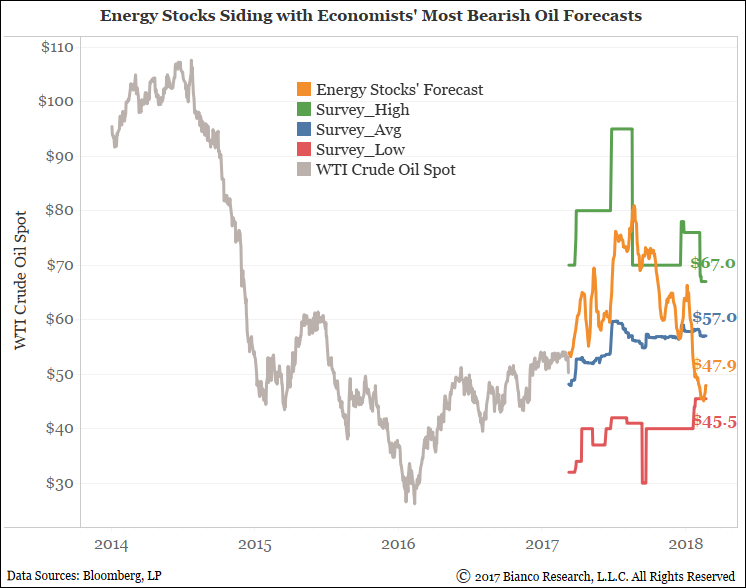
If these sub-industries are a discounting mechanism for oil prices, then we can estimate where investors are expecting oil prices to reside in the not too distant future. The chart below shows WTI crude oil prices in gray and investors’ expectations over the next year in orange. We generate investors’ expectations using rolling returns for the five sub-industries of energy shown above. For comparison, we included economists’ forecasts with survey averages in blue, highs in green, and lows in red.
Investors likely shed expectations for rising oil prices in August 2016. Currently, our estimate of investor expectations’ for oil prices resides at $47.9, just off the lowest economist forecast at $45.5. Investors in these sub-industries are not agreeing with the average economist’s forecast for the year ahead at $57.0.
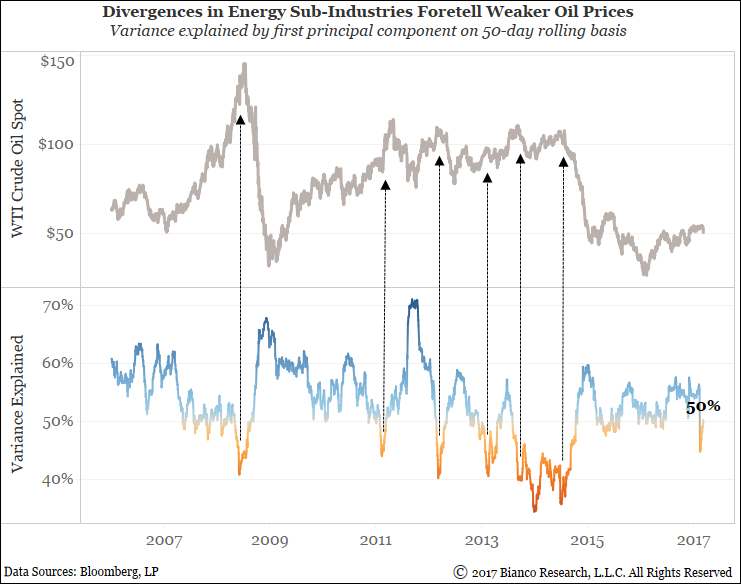
The chart below shows oil prices in the top panel and variance explained by the first principal component over 50-day windows of sub-industry returns in the bottom panel. Think of this ‘variance explained’ metric as an indication of correlation. Abrupt divergences in returns among energy’s sub-industries have historically been a telltale sign of bearish turns for oil prices.
Variance explained dropped well under 50% in mid-February 2017. We are watching closely to see if continued divergences among sub-industries suggests further concern for oil prices.
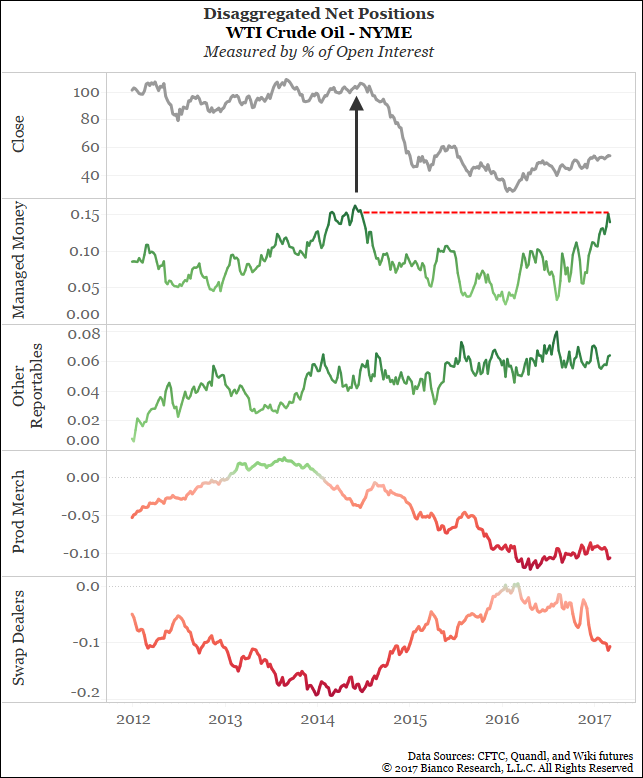
Lastly, fast money in WTI crude oil futures as measured by ‘managed money’ in the Commitment of Traders report is back to its heaviest net long position since oil prices peaked in June 2014. What are they seeing that others are not? Such lop-sided positioning makes oil rallies difficult.
