On Wednesday we said:
Consequently, we are not big fans of this report as a leading indicator of Friday’s payroll report. On a typical Friday afternoon there is a lot of agreement about the inaccuracy of this report. But 3 1/2 weeks later we all seem to forget about this report’s shortcomings and take it as gospel for the upcoming payroll report.
We have been asked to explain the shortcomings of this index further.
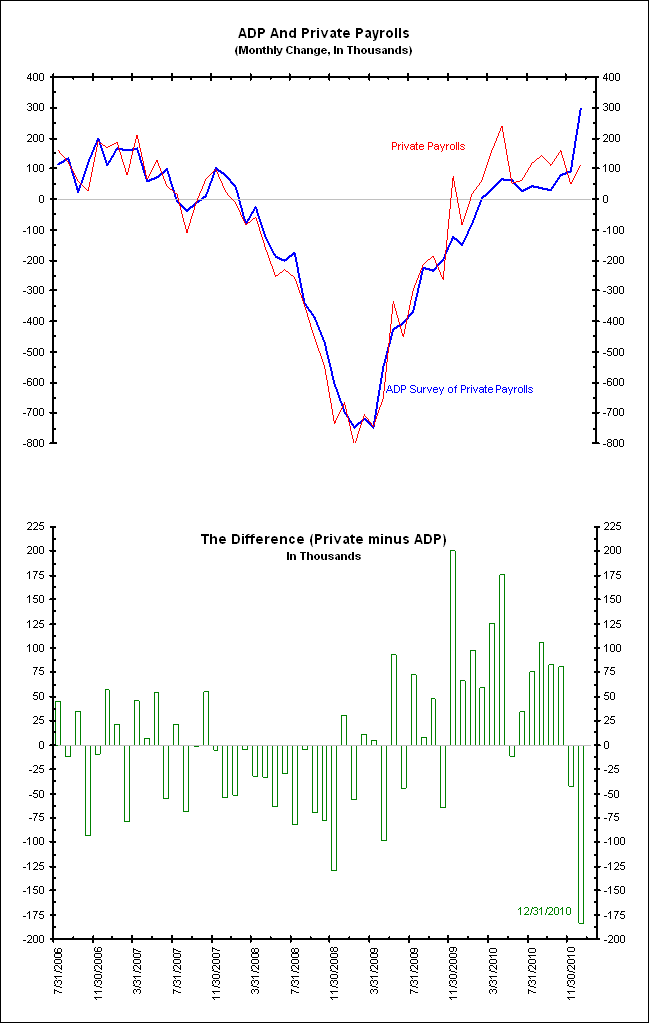
The blue line in the first chart below shows the monthly change in the ADP survey and the red line shows the monthly change in private payrolls. The bottom panel in green shows the difference between these two measures. Since ADP does not survey the government sector, they correctly argue that the benchmark ADP should be measured against is private payrolls.
The problem with the chart below is that it uses the current numbers as opposed to the initial releases. That is, both series have been revised multiple times and the methodology used by ADP in calculating its number has been changed. In others words, if the initial ADP number is meant to be a pre-release of the initial payroll number, this chart is not the way to prove its accuracy.
<Click on chart for larger image>
We also said Wednesday that we don’t believe the ADP release is meant to offer new insight into the jobs market. Instead it’s an attempt to guess what the private payroll number will be 48 hours later. ADP and Macroeconomic Advisors (who compiles this report) hoped that this report could be turned into a subscription service. So far its accuracy has lacked so much that they have not even tried.
The chart below is what everyone thinks they are looking at above. It shows the first release of the monthly change in the ADP survey (blue line) and the first release of the monthly change in private payrolls (red line). The bottom panel in green shows the difference between these two series.
The sharp-eyed reader will note that the difference of first releases (bottom panel in green below) is much wider than the differences of the current releases (bottom panel in green above). Seven times in the last two years first release ADP has diverged by more than 200,000 jobs to the first release of total private payrolls.
<Click on chart for larger image>
Non-Farm Actual Versus Consensus
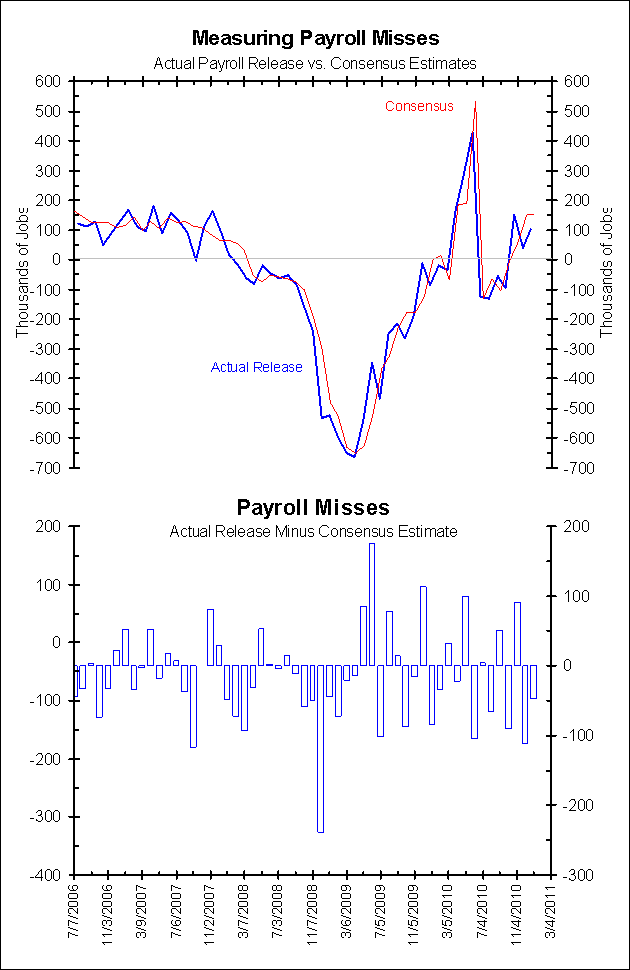
The next chart shows the consensus estimate for the monthly change in non-farm payrolls as surveyed by Bloomberg (red line, top panel) and the first release of the monthly change in non-farm payrolls (blue line, top panel). The difference between these two measures is shown in green in the bottom panel. To repeat, this is not private payrolls but non-farm payrolls (the “headline number”).
<Click on chart for larger image>
What Measure Is Best?
The next table shows some statistics to help determine which measure has the best track record. It shows the “misses” between a release (either private payrolls or all non-farm payrolls) and a forecast of that release (either ADP or a Bloomberg estimate) .
- The left column measures the current release of private payrolls less the current release of ADP (first chart above, bottom panel).
- The middle column measures the first release of private payrolls less the first release of ADP’s forecast (second chart above, bottom panel).
- The right column measures the first release of total non-farm payrolls less a Bloomberg median estimate for all non-farm payrolls (third chart above, bottom panel).
<Click on table for larger image>
The best track record is the measure with the smallest Absolute Median or Absolute Average miss. In both cases this is the Bloomberg consensus estimate which, since July 2006, has averaged a 55,470 jobs miss. First release ADP (the number which came out Wednesday) has the worst track record with an average miss of 75,810 jobs.
Averages can be deceiving, so the standard deviation should be considered as well. The smaller the standard deviation, the more accurate the forecast. Like the median and averages, the best is again the Bloomberg estimate with a standard deviation of 46,080 jobs and the worst is first release ADP with a standard deviation with a 61,730 jobs.
What estimates led to the most extreme misses? Again first release ADP had the most extreme outliers (199,000 and -290,000) compared to extreme misses based on the Bloomberg estimates of 175,000 and -238,000.
Finally, one can look for bias in the data by looking at the chart.
- The first release ADP estimates were positive (the release was above the estimate) 20 of the last 24 months, back to December 2008.
- Between November 2007 and November 2008 (13 months) all the ADP first release estimates were negative (the release was below the estimate).
- Between July 2006 and October 2007 the number was more balanced – 8 positive estimates, 6 negative estimates and two estimates that were within 1,000 jobs of the release.
By contrast, the Bloomberg estimate was more balanced save the 8-month period between September 2008 and April 2009 when all the estimates were too high.
Conclusion
The charts and table above do not support the idea that first release ADP has better predictive ability than the consensus estimate (as surveyed by Bloomberg) in predicting the first release of the total non-farm payrolls series. If you are dissatisfied with the consensus’ ability to guess the payroll report you should be more dissatisfied with the first release of ADP.
The statistician could argue there is not a significant difference between first release ADP and the Bloomberg estimate. We would not push back against that assessment, concluding that both are poor predictors.
The ADP release is subject to the same biases and misses as any other predictive indicator. This being the case, why does Wall Street continue to revise its payroll estimates every month based on this release? This report has not proven it deserves this much respect.
Until the ADP first release can consistently and accurately predict the payroll number over time, we would not view this number any differently or as offering any additional insight than the consensus estimate provided by Bloomberg.


