-
- Bloomberg – Energy Prices and Rents Will Keep Rates Up and Markets Down
An energy crisis after a long period of commodity under-investment only adds to inflationary pressure. The days of central banks riding to the rescue of a sliding economy with rate cuts are over. Now, we face a world of rate hikes until inflation comes to heel whether or not the economy can handle it.
- Bloomberg – Energy Prices and Rents Will Keep Rates Up and Markets Down
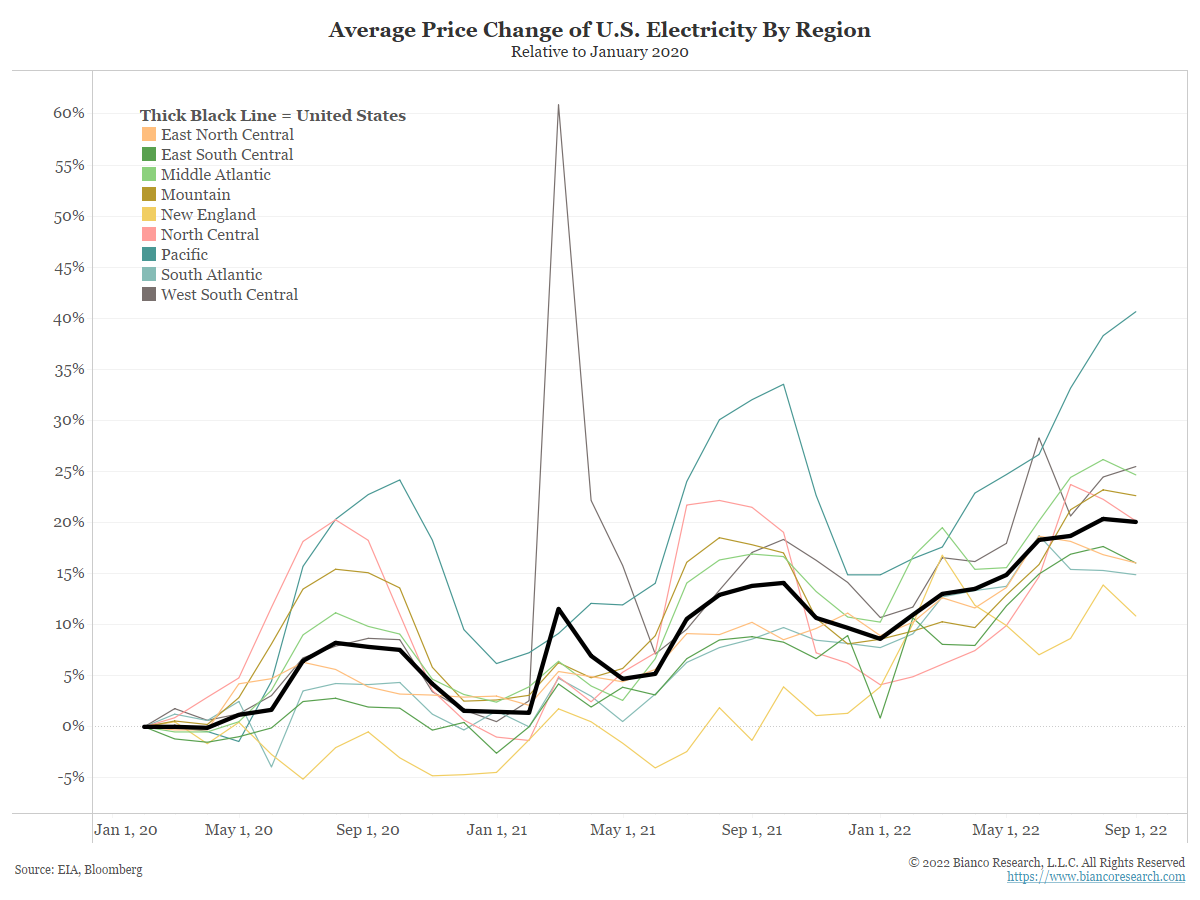
The second breakdown by region shows energy costs rising the most in the South Atlantic region, which includes states from Maryland to Florida along the east coast.
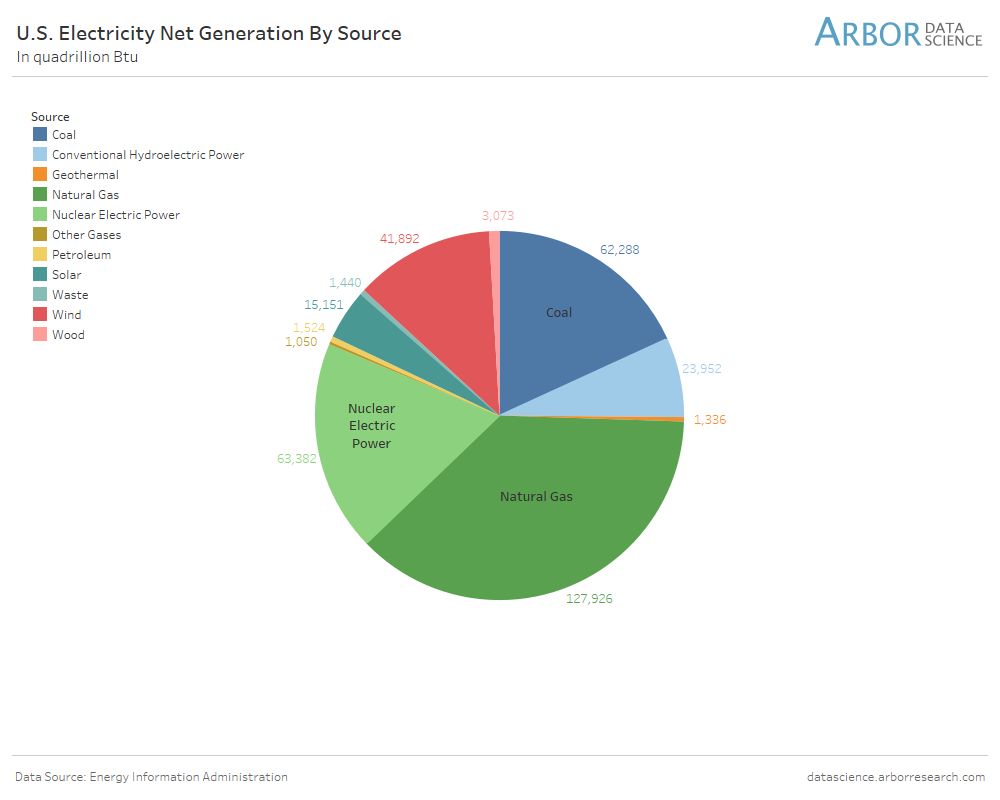
Where Does U.S. Energy Come From?
The United States can generate energy from a range of resources. The pie chart below comes from our colleagues at Arbor Data Science and breaks down U.S. electricity generation by source.
Similarly, the EIA shows this over time below.
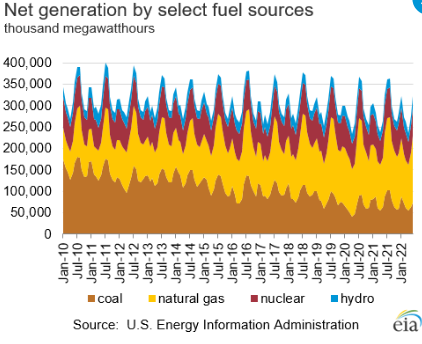
Natural gas has two big uses: electricity generation and space heating. Because of its use in space heating, natural gas usage tends to be highly seasonal. As natural gas prices continue to move higher, the cost of energy and subsequently inflation rise with it.
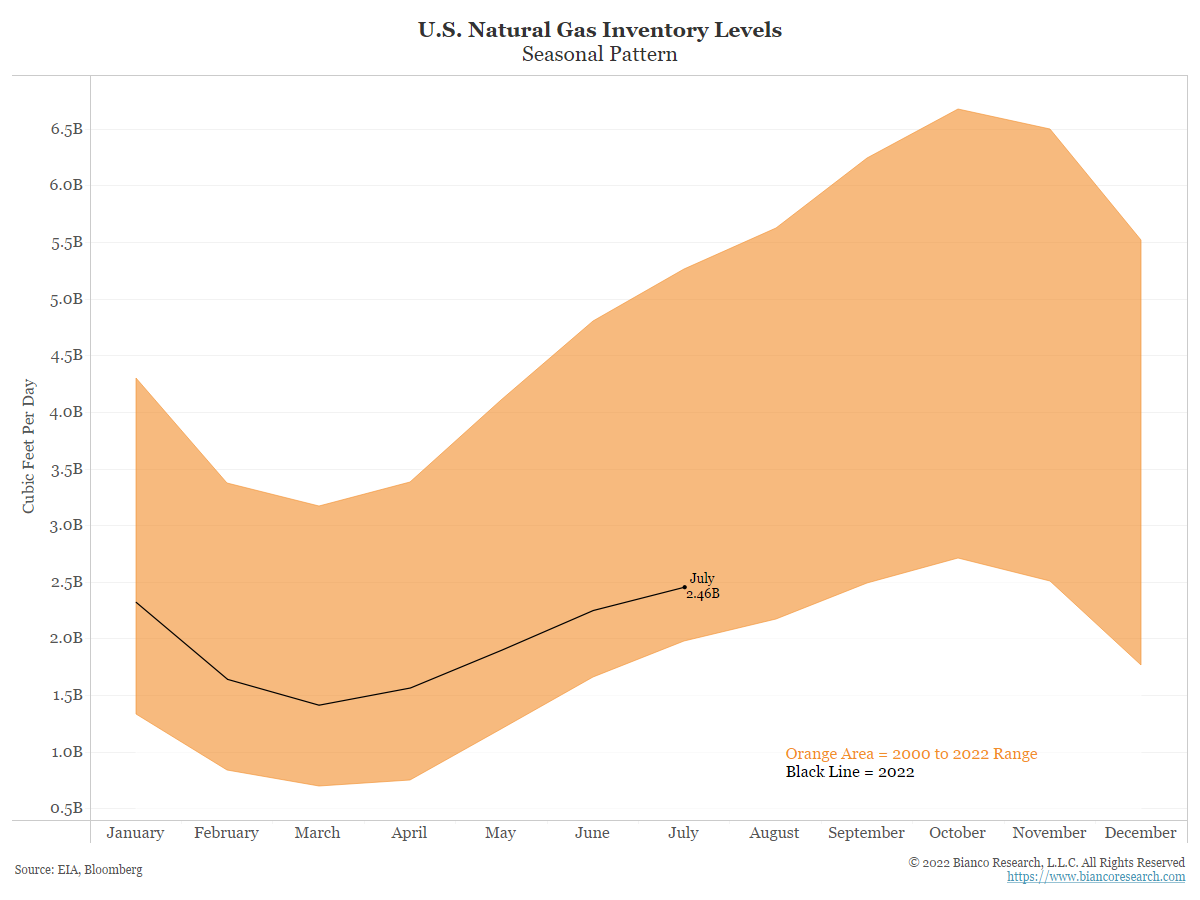
Lastly, when compared to the range of inventory over the last couple decades, US natural gas inventory levels are close to their lowest levels for this time of the year. The orange area in the chart below shows the range of storages filled since 2000. The black line represents 2022 levels. While seasonality is a factor in natural gas inventories, 2022 levels are at the lower end of the range for the mid-summer months.
Conclusion
With energy markets strained across the globe, higher prices are a significant contributor to persistent inflation. In the United States, higher natural gas prices are causing pain up the supply chain as producers attempt to pass on price increases, driving up costs for households. As central banks focus on killing inflation, a remedy to high energy costs continues to be elusive.
Summary
There are currently two main factors driving record levels of inflation, housing and energy. While Europe is currently facing an intolerable energy crisis, the United States is faring slightly better on the energy front for the time being.
Comment
Energy costs in the United States have risen substantially in the past 18 months, contributing significantly to the rise in inflation. The first chart below details the subcomponents of CPI and each of their contributions to headline inflation.
In July 2022, energy (red) contributed the greatest to headline inflation, making up 2.37% of the 8.5% headline reading.
In the past two weeks, we have highlighted several different energy markets, domestic and international, to illustrate how market participants are reacting to the strain on energy supplies and rising costs. To understand what is happening in specific energy markets, see the links below:
Where Are Prices?
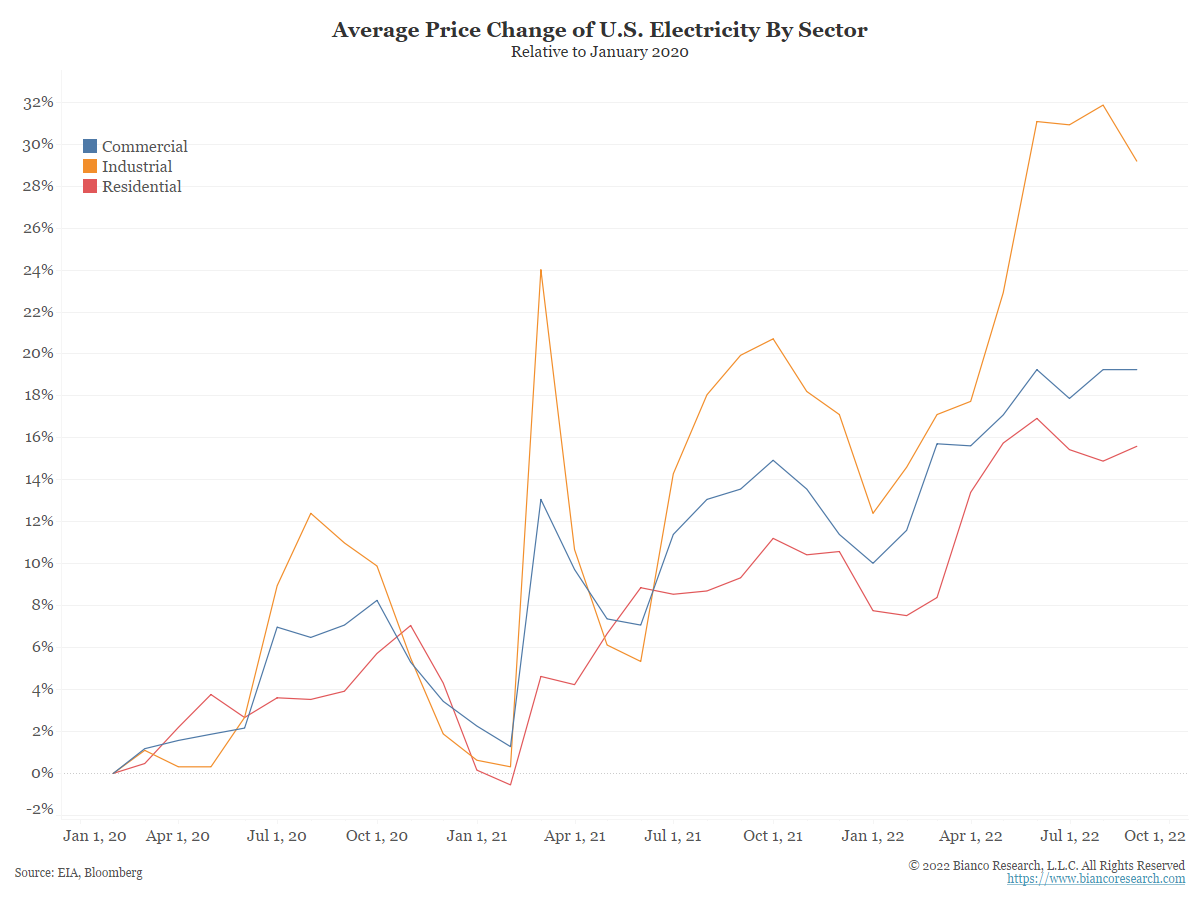
The next two charts show the change in the average price of U.S. electricity broken down by sector and region.
Residential energy prices are about 16% higher from January 2020, while industrial prices, the prices paid by manufacturers of goods, are nearly 30% higher in the same period.
When manufacturers and factories have higher costs, they typically pass these price increases on to the consumer.