- Reuters – U.S. apartment vacancies fall in Q1, rents edge up
Reis Inc’s quarterly report showed the vacancy rate dropped to 6.2 percent in the first three months of the year, down from 6.6 percent in the fourth quarter. It was the steepest fall since the commercial real estate research firm began tracking the market in 1999. [CR note: the vacancy rate was 8 percent in Q1 2010]. - Bloomberg – Apartment Vacancies in U.S. Fall to Lowest in Almost Three Years
Apartment owners had a net increase in occupied space of more than 44,000 units, the most for a first quarter since 1999 and almost double the number from a year earlier, Reis said. The first quarter tends to be a slow period for rentals since more leases are signed in the warmer months, the company said. About 6,000 units came to market during the first quarter, the fewest since Reis began compiling data in 1999. Effective rents, or what tenants actually pay, increased in 75 of the 82 markets Reis tracks, to an average $991 a month from $967 a year earlier and $986 in the fourth quarter.
Comment
<Click on chart for larger image>
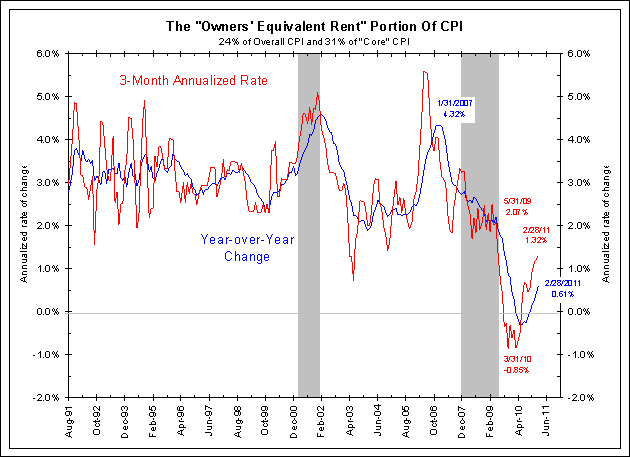
In recent months rents have been moving higher. This is consistent with the REIS survey highlighted above as well as a February story about rising rents in Chicago and a January story predicting U.S. rents were poised to move up by 5% this year.
Also, as we highlighted in a report last month, forward-looking indicators of rents like the relative performance of apartment REITs are also suggesting rents will continue higher. Almost any way it is cut, rents are likely to move higher this year, taking 40% of core inflation with it.
<Click on chart for larger image>
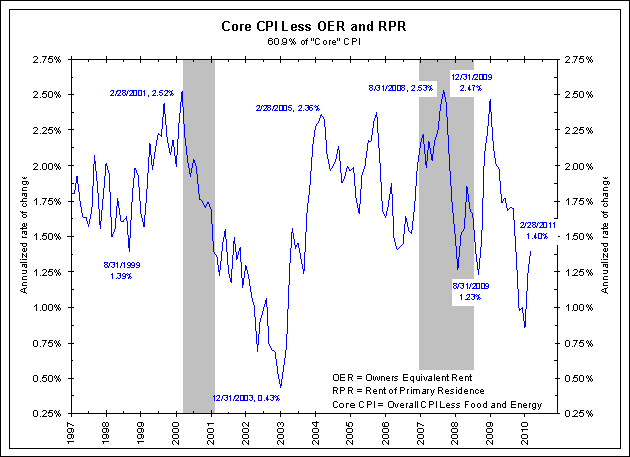
Finally, what about the other 60% of core inflation? The chart below shows that this measure is on the upswing as well.
<Click on chart for larger image>


If predicting inflation is about predicting the next move in core CPI (and not the abstraction of “more or less inflation”), then surveying the residential rental market is the best indicator to watch. This is why we focus on OER. It drives the statistic of core CPI.
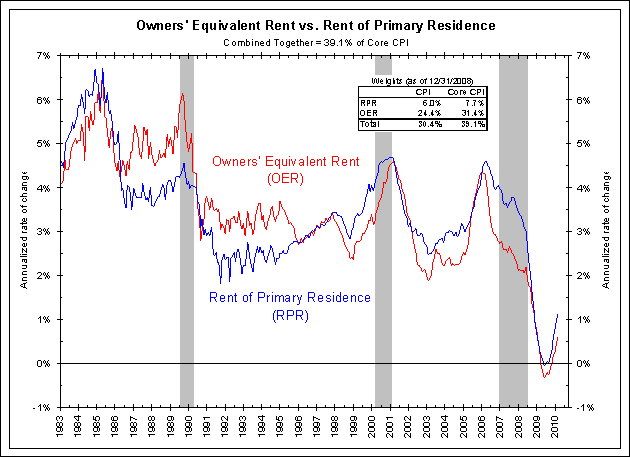
The chart below shows that nearly 40% of core inflation is made up by owners’ equivalent rent (OER), which is the BLS’s measure of housing inflation, and rents of primary residences (RPR), which is the BLS’s measure of renter inflation taken from the same survey.