<Click on chart for larger image>
- Bloomberg.com – Budget Deficit in U.S. Increased to $188.2 Billion in March
The U.S. government, on course to reach a record annual budget deficit, posted a monthly shortfall of $188.2 billion in March, wider than a year earlier, Treasury Department statistics showed today. Last month’s deficit was up from a $65.4 billion gap in March 2010, when the government marked down the cost of the Troubled Assets Relief Program by $115 billion. The White House and Congress last week reached agreement on a spending plan for the current fiscal year, which started Oct. 1, and face another fiscal hurdle next month with the prospect of reaching the statutory debt limit of more than $14 trillion. Last week’s agreement averted a shutdown of government agencies. “It has a long way to go to zero at this rate,” said Michael Englund, chief economist at Action Economics in Boulder, Colorado. The agreement to cut $38 billion from the 2011 budget is “pocket change,” although “it’s certainly a number that breaks in the right direction.”
Comment
<Click on chart for larger image>
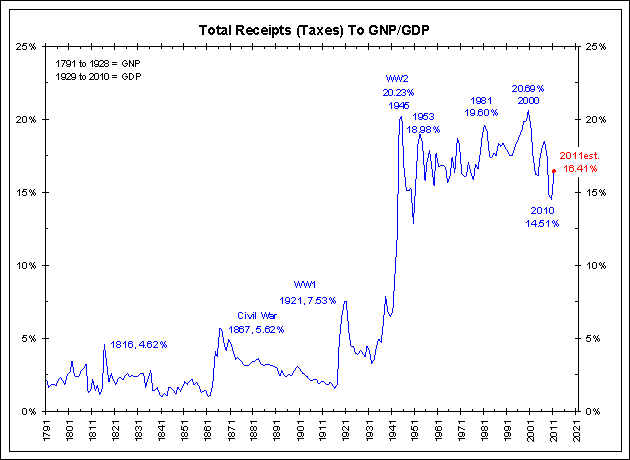
The blue line in the top panel of the first chart above shows total revenues (taxes). Note that revenues are down. This is confirmed by the next chart which shows taxes slumped to 14.51% of GDP, a 50-year low.
<Click on chart for larger image>
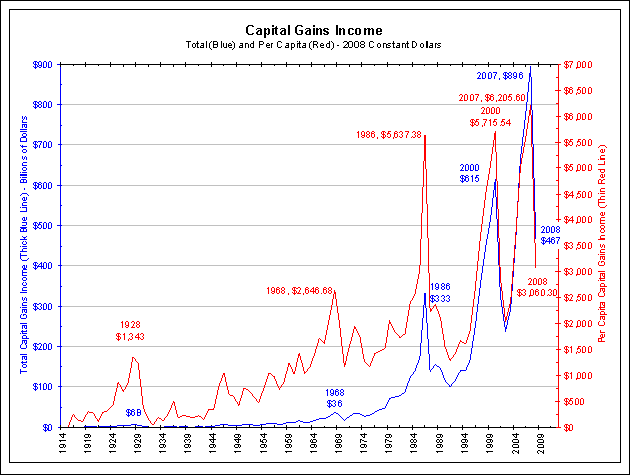
Why did revenues slump? In nominal terms revenues slumped $463 billion from 2007 to 2010. As the next chart shows, capital gains fell by almost $400 billion between 2007 and 2008 (latest data). This summer the IRS will release 2009 data.
Simply put, the loss of capital gains accounts for almost all the loss in tax revenues. We addressed this in a March 2007 Commentary titled “Can The Stock Market Balance The Budget.” We said:
During the recent period of increased market volatility, we have been arguing the U.S. equity market is the center of the financial universe. Its movements drive other markets.
With this new income data, we can vividly see that the fortunes of the stock market drive the federal surplus/deficit as well. In this vein, the center of Washington is now on the corner of Broad and Wall.
In fact, it is possible, all things held equal, that with another 20% to 30% stock market gain before December 31, 2008, President Bush could leave office as he entered, with a budget surplus. Of course, a bear market could do the opposite.
The endless debate in Washington is what to do about the federal deficit. Economists fret about its effect on both the dollar and interest rates. They are in fact arguing over the effect of the stock market on other financial markets
This is a simple concept many are still having a hard time accepting.
<Click on chart for larger image>
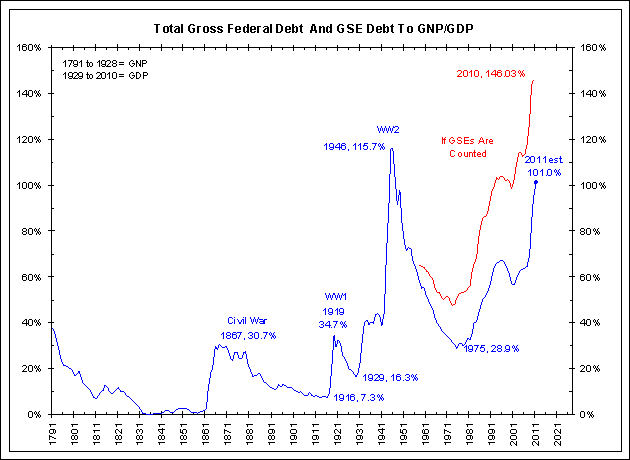
Finally, see the green line in the bottom panel of the first chart. It shows that tax revenues cover only 61.3% of government spending for the 12 months ending March 2011. The other 38.7% was borrowed. As can be seen in the chart below, this results in an exploding debt to GDP ratio and the following warning from the IMF.
- The Financial Times – US lacks credibility on debt, says IMF
The US lacks a “credible strategy” to stabilise its mounting public debt, posing a small but significant risk of a new global economic crisis, says the International Monetary Fund. In an unusually stern rebuke to its largest shareholder, the IMF said the US was the only advanced economy to be increasing its underlying budget deficit in 2011, at a time when its economy was growing fast enough to reduce borrowing.
<Click on chart for larger image>
Later today the President will unveil his plan to balance the budget. Keep in mind the numbers above, namely:
- Spending is at an all-time high and growing rapidly.
- Revenues are at a 50-year low because capital gains have disappeared in the wake of the financial crisis.
- Debt is exploding higher and the government has to borrow nearly 40% of its yearly expenses.
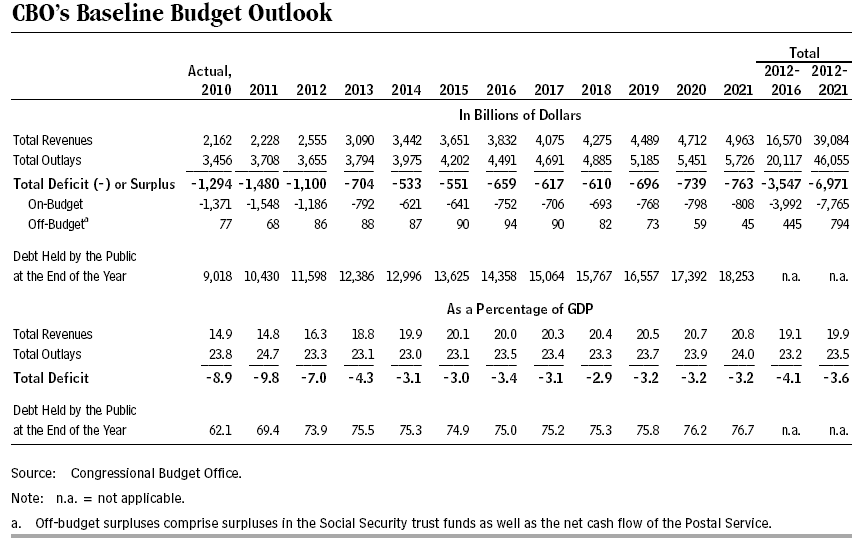
Finally, as the president speaks, keep the following table in mind. According to the Congressional Budget Office, between 2012 and 2021 the federal government is expected to spend $46 trillion, take in $39 trillion and increase the national debt by almost $7 trillion. Representative Paul Ryan’s budget proposal is expected to slash $4 trillion from these totals over the next 10 years, or about 10%. The President is expected to call this “extreme” and propose something between $1 trillion (2.5%) and $4 trillion (10%).
None of this is a profile in courage.
<Click on graphic for larger image>
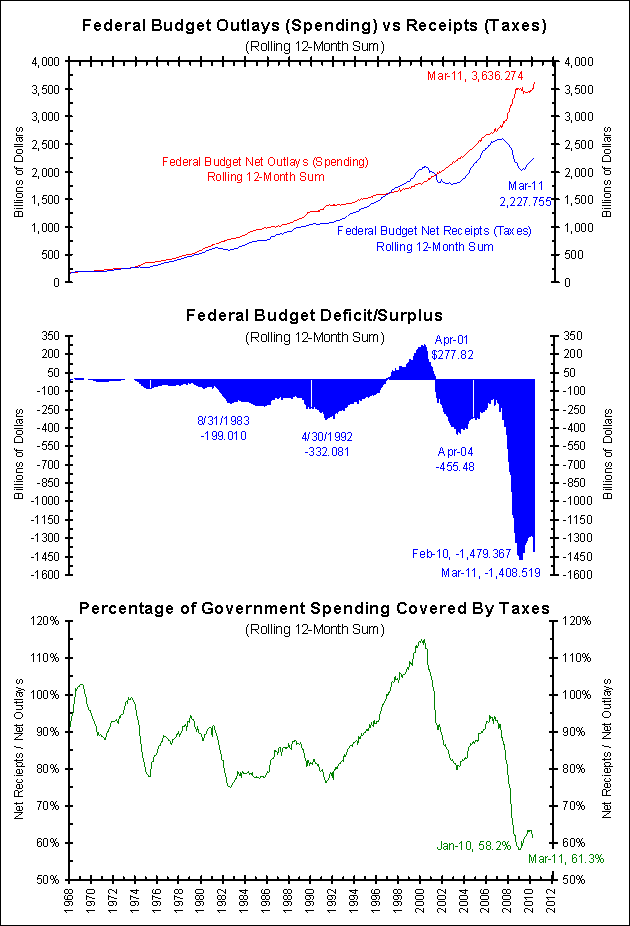
The red line in the top panel above shows a rolling 12-month sum of government spending. In the 12 months ending March 2011, the federal government spent $3.64 trillion, a new record. The recent budget deal last week will cut $0.038 trillion over the next five months from this total. Feel better?
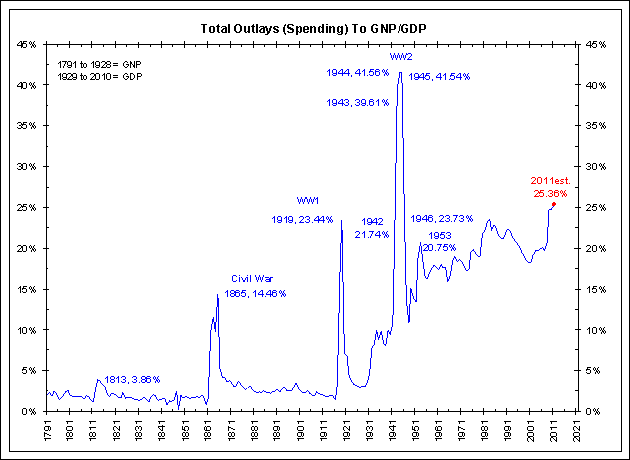
As the chart below shows, spending is estimated to be more than 25% of GDP. This would be the fourth highest total ever. Only the three war years of 1943 (39.61%), 1944 (41.56%) and 1945 (41.54%) were higher.