- The Wall Street Journal – Mark Gongloff: Inflation? Numbers Show Faith in Fed
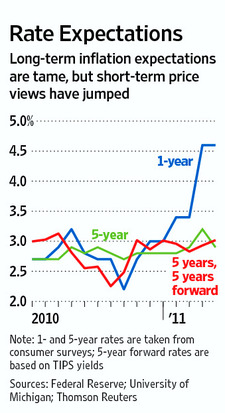
Ben Bernanke held the first postpolicy-meeting news conference by a Federal Reserve chairman in part to bolster confidence that the Fed remained committed to controlling inflation. The words “inflation expectations,” or some variation of them, were uttered 21 times in the session. … TIPS are regularly adjusted for inflation, so this gap in yields, called the break-even inflation rate, shows how much future interest traders are willing to give up for inflation protection, which can be interpreted as the future inflation rate they expect. The 10-year break-even inflation rate earlier this month surged to 2.66%, the highest since 2006. Amid a host of downbeat economic data in recently, that rate has retreated to less than 2.6%. These numbers are relatively high in the short history of break-even inflation rates, but that period was one of historically low inflation. And the simple break-even inflation numbers include short-term inflation worries. To get a clearer look at long-term inflation expectations, many take the break-even inflation calculation another step further and come up with a “forward” break-even rate, which tries to strip out short-term noise to get a truer read on long-term inflation expectations. One favorite such measure is the “five-year, five-year-forward” break-even rate, which measures inflation expectations starting five years from now and running five years from that date. The Federal Reserve Bank of New York’s five year, five-year forward break-even rate estimate, widely acknowledged as the gold standard of such rates, was recently 3.02%, slightly below its level in November, when the Fed announced its $600 billion quantitative easing program, or QE2.
Comment
<Click on chart for larger image>
<Click on chart for larger image>
<Click on chart for larger image>
Long-Term
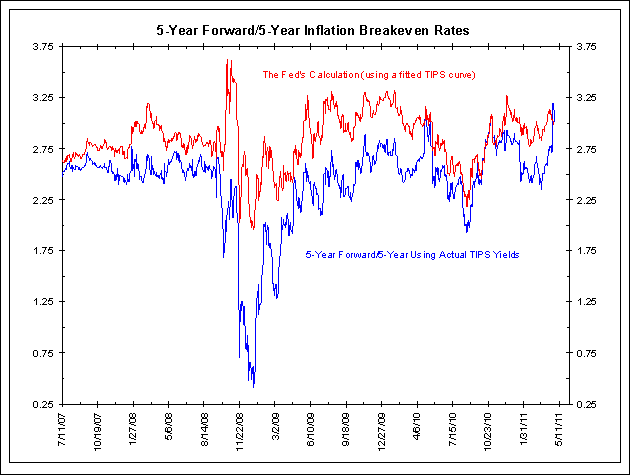
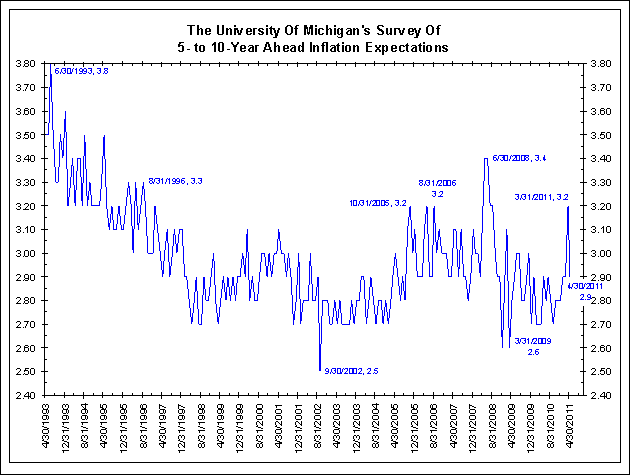
The Federal Reserve also watches long-term inflation expectations. These include the 5-year forward/five-year TIPS inflation breakeven rate (first chart), as explained above, and the University of Michigan’s five-year inflation survey (second chart).
These measures are a lot more difficult to gauge. As the first chart shows, there are two measures of 5-year forward/five-year inflation breakeven rates. The red line shows the Federal Reserve’s preferred measure using fitted yield curves in its calculation. The blue line uses actual measures.
In the end it should not matter which measure one uses as they should give roughly the same answer. They both currently show expectations of a 3% inflation rate between 5 and 10 years from now. This is very close to the Michigan survey that shows 2.9%.
<Click on chart for larger image>
<Click on chart for larger image>
Comment
The Wall Street Journal and the Federal Reserve will tell us that 3% is an acceptable number. We see a few problems with this conclusion.
First, as we noted earlier this month, these measures are not very good predictors of what will actually happen. This was confirmed by a New York Federal Reserve study in 2008 that said the University of Michigan’s 5-year survey is a poor indicator. We agree. See the chart above. It seems like this measure shows nothing but noise around 3%. How the Federal Reserve can say they need to tighten when this measure is above 3% and everything is OK below 3% is beyond us.
Second, the five-year forward/five year measures are open to wide interpretation. The Federal Reserve’s measure using fitted yield curves (red line above) is very volatile and runs at a higher level than is apparent when using actual yields (blue line). Both the Federal Reserve and The Wall Street Journal take comfort that this measure is not at a multi-year high and concluded that QE2 (aka, money printing) is accepted by the marketplace. However, using actual yields shows a new multi-year high. This is not the the message the Federal Reserve prefers at the moment, so The Wall Street Journal summarily tells us that the measure using a fitted yield curve is “widely acknowledged as the gold standard of such rates.” This is the first we have heard of this and do not believe such a blanket statement is possible to make.
If you are simply trying to gauge long-term inflation expectations, we cannot say one is better than the other. Either measure works, but one can be chosen over the other if you prefer to draw a different conclusion. See the Federal Reserve’s gold standard in 2008. It gave many false readings given the inherent volatility of measuring fitted yield curves.
Finally, why is 3% an acceptable measure of long-term inflation? Remember, this is a measure of headline inflation. But, we know the Federal Reserve prefers core inflation when setting policy. Further, the Federal Reserve believes core measures above 2% are considered uncomfortably high. So, what does a long-term forecast of 3% headline inflation translate into for core inflation?
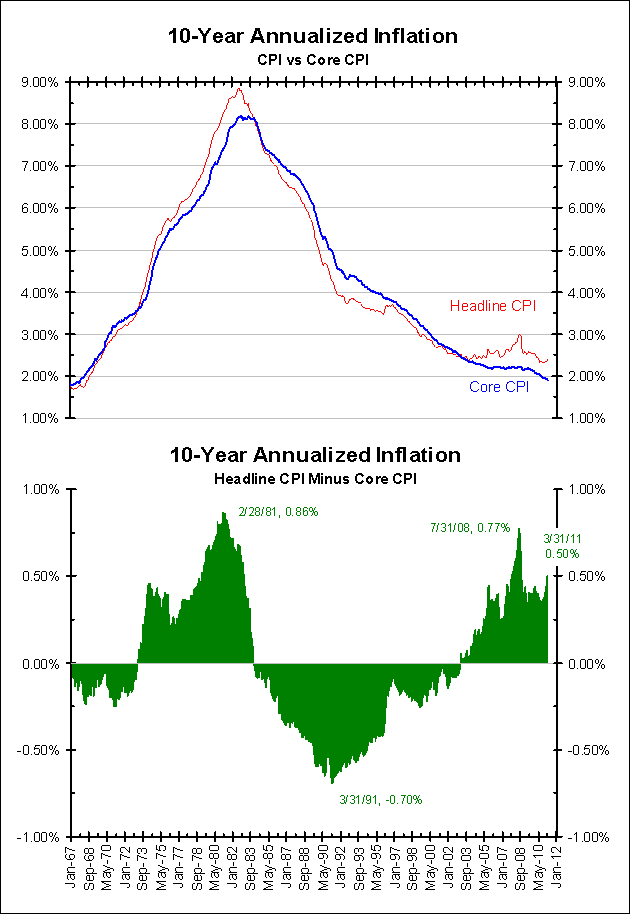
As the chart below shows, the 10-year spread between headline and core inflation is 0.50%. If this relationship holds, it suggests these measures are looking for 2.5% core inflation. This is too high.
Further, if one believes that high commodity prices will be peaking in the next few years, a position that Bernanke endorsed this week, then one should look for core inflation to run higher than headline inflation. So, a 3% long-term headline inflation forecast could easily translate into more than 3% core inflation, a level that would undoubtedly make the Federal Reserve squirm.
Lastly, by this view, a 3% long-term headline inflation forecast can work for the Federal Reserve if one can make the case that headline inflation, over the long-term, will run more than 1% above core inflation. In the 44 years of history shown below, this has never happened. So, the only way the Federal Reserve can conclude that 3% is acceptable is to expect something that has never happened before.
Conclusion
We agree that inflation expectations are key to upcoming Federal Reserve policy. They are probably more important than anything else, certainly more important than the indicators mentioned in the article below. We also agree with the Federal Reserve that inflation expectations are at the upper end of what is acceptable.
We, however, disagree with the Federal Reserve that these measures are “stable” and endorsing QE2. The medium-term measures are rising. The current slope suggests they could reach levels that would be problematic for the Federal Reserve by the end of the summer. Finally, the Federal Reserve seems to be twisting the long-term measures to give them the conclusion they want, that inflation is not a problem.
This is how policy mistakes are made.
<Click on chart for larger image>
- BusinessWeek – Why a Fed Rate Hike May Be Delayed
The GOP’s calls for austerity increase the likelihood of long-term budget cuts, and mean interest rates may hold longer than expected
None of the controversial budget-cutting proposals put forth by Paul Ryan have become law. Nor has the federal budget deficit shrunk by as much as a penny. Yet Ryan’s rhetoric has already forced President Barack Obama to respond with his own budget-taming plans. In the process, Ryan is also changing the way the market thinks about the Federal Reserve’s next move, and that says something about the dilemma central bank Chairman Ben Bernanke faces. A month ago, before the budget austerity debate started in earnest, traders in the federal fund futures market in Chicago saw a better than 50/50 chance that the Fed would raise interest rates at or before its meeting on Jan. 25, 2012. The thinking was that Bernanke would have to tap on the brakes as inflation reappeared, gross domestic product headed for nearly a 4 percent expansion in 2012, and cheap money from the Fed flooded the world. It would be time to start taking away the punch bowl.
We seem to address inflation expectations every day. For now, it seems as though this is the measure that will dictate when the exit strategy starts or if QE3 materializes. Little matters more to the Federal Reserve. Nothing else was mentioned 21 times at the press conference this week.
The story above, like the one by Jon Hilsenrath earlier this week, continues to push the idea that the market is endorsing QE2 and does not see a big inflation problem. We believe this is only half correct.
Inflation expectations can be looked at over the medium-term as well as the long-term.
Medium-Term
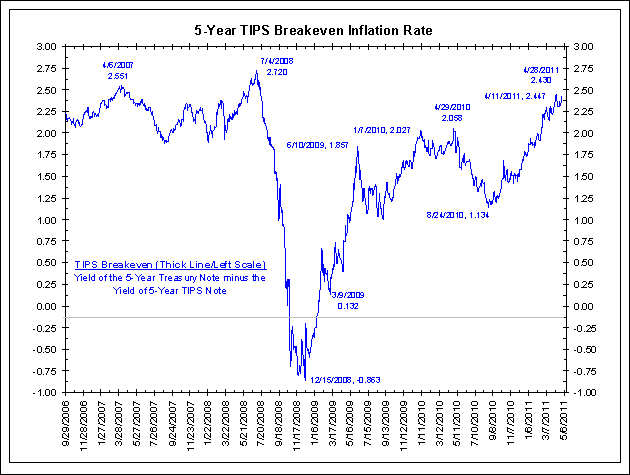
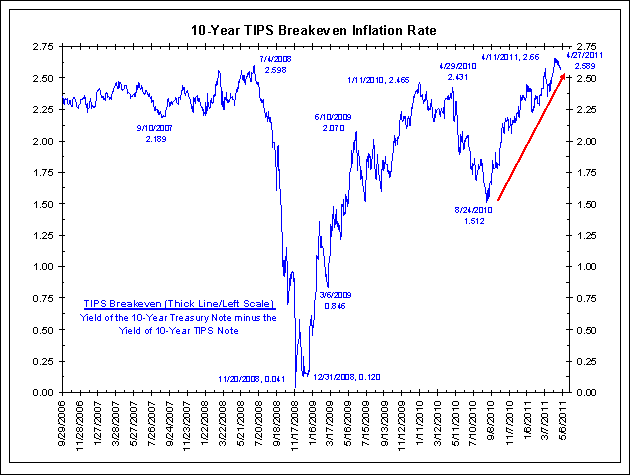
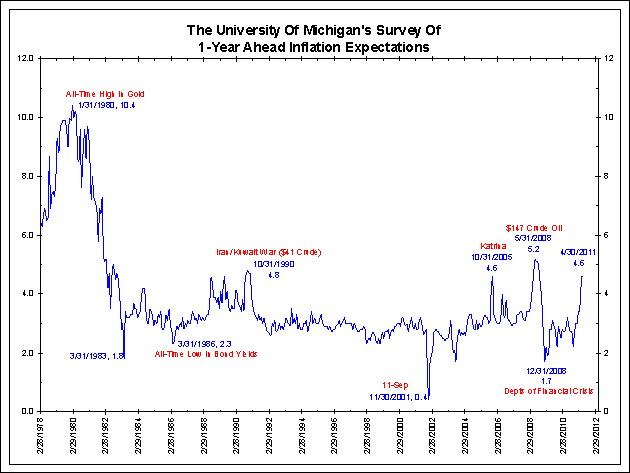
Medium-term expectations can be gauged via the 5-year TIPS inflation breakeven rate (first chart), the 10-year TIPS inflation breakeven rate (second chart) and the University of Michigan’s 1-year inflation survey (third chart below).
All these measures have approached the upper end of what is deemed acceptable. Yesterday we noted that Bernanke’s comments seem to agree with this characterization. However, we disagreed with Bernanke’s assessment that these measures are “stable”. Below we see strong uptrends which, if they continue, could result in inflation reaching unacceptable levels by the end of the summer or the fall.