America’s unofficial holiday is this weekend, the Superbowl. What can this event tell us about the economy?
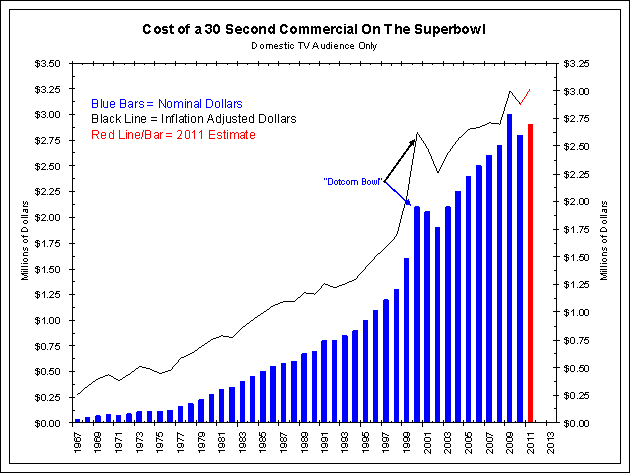
The first chart below shows the cost of a 30-second commercial (domestic audience only) during the Superbowl. The blue bars show the actual cost, while the black line shows the cost on an inflation-adjusted basis. In red are the 2011 estimates.
A 30-second commercial this Sunday should cost around $2.9 million, up from $2.8 million last year. This is a 3.57% increase and not much above the 1.5% gain in inflation. However, last year ad rate saw a decline of ‘s 6.67%, only the fourth decline ever (1971, 2001 and 2002). If the 2011 estimate is correct, Superbowl ads will not fully recover last year’s decline, meaning the record for a 30-second Superbowl commercial will remain at 2009’s price of $3 million.
<Click on chart for larger image>
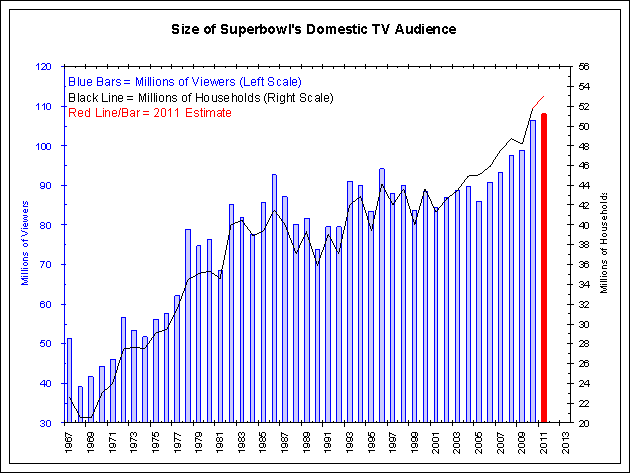
While the advertising rates shown above are interesting in their own right, the size of the audience must also be considered. The next chart shows the number of viewers as blue bars (in millions), the number of households as the black line and the 2011 estimate in red. For 2010, the Superbowl’s domestic audience was 106.476 million. The number of households was also a record at 51.728 million. The audience in 2011 is forecasted to set a new record of 108 million with total households at 53 million.
<Click on chart for larger image>
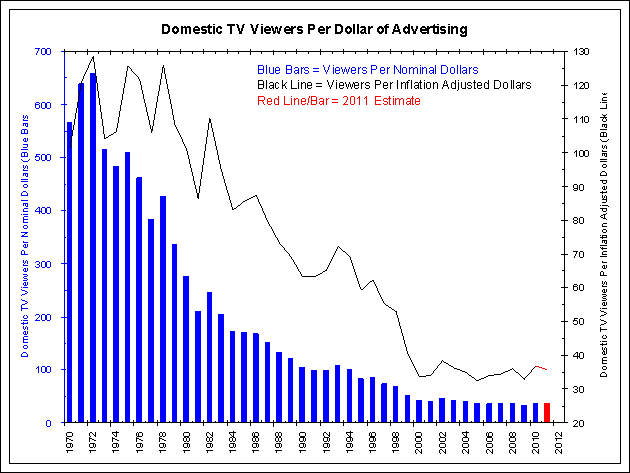
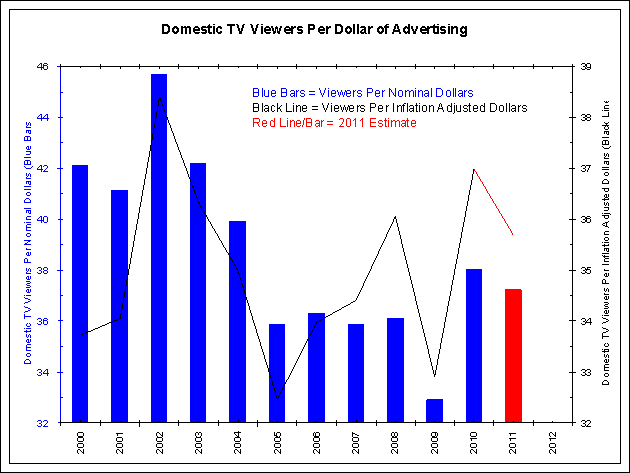
Combining the two series together, we get the next two charts. Both show exactly the same thing, differing only by time frame as the second chart below only shows the last 10 years.
These charts divide the size of the domestic TV audience by the cost of a 30-second commercial. The blue bars show the number of views per nominal dollar and the black line shows the number of viewers per inflation-adjusted dollar. The red shows the 2011 estimate.
<Click on chart for larger image>
<Click on chart for larger image>
In the late 1960s and early 1970s, Superbowl advertising was a real deal. Each dollar was paying for hundreds of prospective viewers. By the late 1980s each dollar of adverting was still paying for about 100 prospective viewers. As the second chart shows, in the last 10 years each dollar of advertising was paying for less than 50 viewers, bottoming at 33 viewers per advertising dollar during 2009’s Superbowl.
These charts suggest Superbowl advertising is no longer a growth industry, at least domestically. The audience size seems to have peaked just above 100 million viewers (about one-third of the country, nearly one-half if only adults are considered). Therefore, we believe the per capita cost of Superbowl advertising now moves up and down with the economy, unlike the 1970s when Superbowl advertising was a growth industry and increased dramatically each year even if the economy was struggling as it was in 1974/1975 and from 1979 to 1981.
As the last chart above shows, 2011 advertisers are estimated to be getting less viewers per dollar than 2010, but are still getting a good deal compared to most of the last 10 years. This suggests that advertisers are somewhat more willing to bid up for ad time this year relative to last year but not willing to pay for boom-time rates of near 33 viewers per dollar like earlier this decade. The 9% unemployment rate suggests over 9.5 million viewers will be jobless and will therefore be less coveted by advertisers.
This year’s Superbowl advertising, consistent with other measures of the economy, shows an economy slowly recovering from the financial crisis.


