Today (March 16) the FOMC meets. It is the first regularly scheduled one-day meeting since September 16, 2008, two days after Lehman filed for bankruptcy and the day the Federal Reserve approved an $80 billion loan to AIG. (the FOMC has conducted five unscheduled one-day meetings since September 2008.)
What Will The Federal Reserve Do?
As far as this meeting goes:
- We expect the statement wording to be close to the last statement (January 27). In particular, we expect the phrase exceptionally low levels of the federal funds rate for an extended period to remain and we expect Thomas Hoenig (Kansas City Fed President) to dissent again about this phrase.
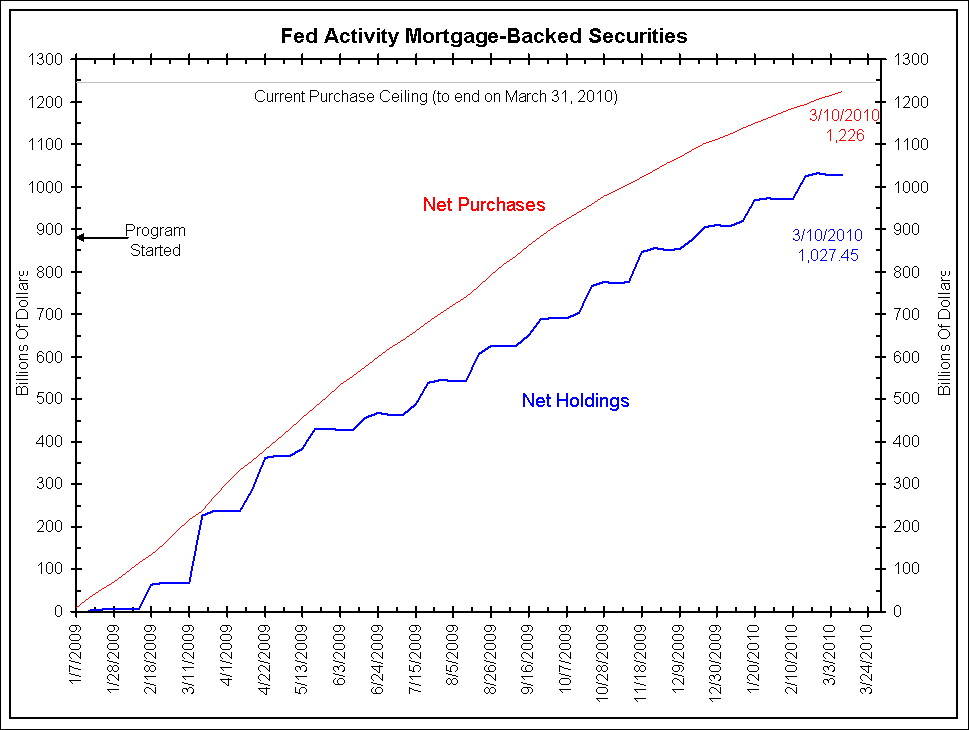
- We expect the Federal Reserve to reiterate that the mortgage purchase program will end as scheduled on March 31. So, expect this phrase to show up again:
In order to promote a smooth transition in markets, the Committee is gradually slowing the pace of these purchases, and it anticipates that these transactions will be executed by the end of the first quarter. The Committee will continue to evaluate its purchases of securities in light of the evolving economic outlook and conditions in financial markets.
Any deviation in this wording that suggesting the Federal Reserve might continue this program beyond March 31 would be a big deal.
<Click on chart for larger image>
- Finally, we expect the FOMC’s economic assessment to be little changed:
Although the pace of economic recovery is likely to be moderate for a time, the Committee anticipates a gradual return to higher levels of resource utilization in a context of price stability.
That said, they might add wording about the January/February snowstorms making some of the current economic data difficult to interpret.
What Should The Federal Reserve Do?
Count us among those that worry about inflation. Therefore, we agree with Thomas Hoenig that the phrase, “exceptionally low levels of the federal funds rate for an extended period” should be eliminated. We also disagree with this phrase:
With substantial resource slack continuing to restrain cost pressures and with longer-term inflation expectations stable, inflation is likely to be subdued for some time.
Why are we worried about inflation? The following is from our conference call last week:
Is There A Core Inflation Problem?
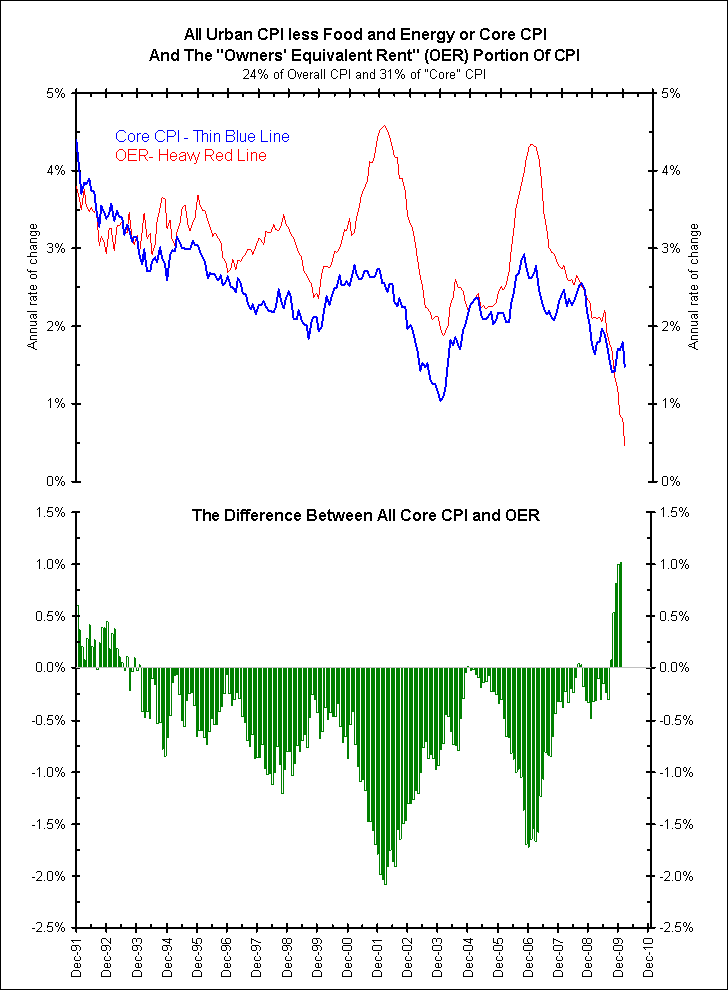
In the chart [below] the blue line is core CPI. The red line is owners’ equivalent rent, or OER. As the headline of the chart says, in the top panel, 31% of core inflation is owners’ equivalent rent, so it’s roughly around a third.
 <Click on chart for larger image>
You’ll notice that the red line is collapsing.
The green bars on the second panel below show the difference between core inflation and OER. Normally, OER runs at a higher rate than overall core inflation, and that is signified by the negative bars. But now the positive bars are showing that core inflation is actually higher than its biggest component – OER.
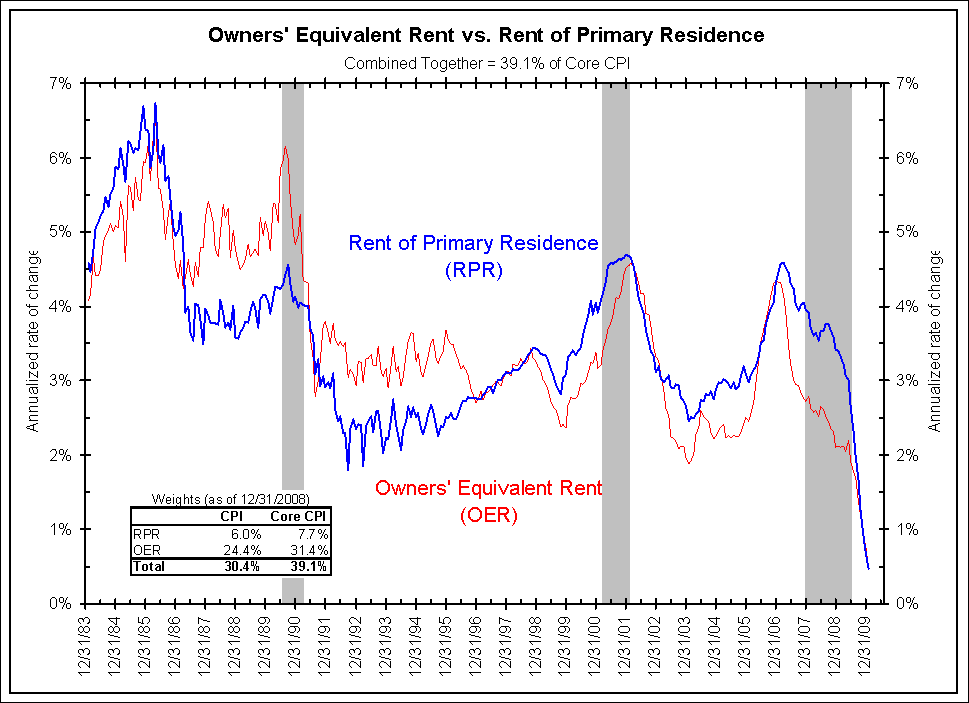
One of the reasons that you’re seeing core inflation being held at bay is because owners’ equivalent rent has been falling apart. And if you look at the next chart, there’s a table in the upper right corner, and on that table, we detail some weights in the CPI calculation.
 <Click on chart for larger image>
There’s another measure that’s very similar to it, which is called rent of primary residences. This uses the same series as OER which is a survey of rental units. They put the data into an econometric model, from which they calculate housing inflation, how much of your house’s appreciation was due to inflation versus how much was due to real growth or real appreciation beyond inflation.
They use the same data in a different econometric model to calculate rent inflation — so if you are a renter, how much of your increase in rent is due to inflation as opposed to supply/demand characteristics that the landlord can just get away with more. That’s another 6% or so of overall inflation. And it’s another 8% or so of core CPI.
Housing’s Effect On Core Inflation Larger Than Thought
The chart above shows those two series – in blue, rents of primary residence and, in red, owners’ equivalent rent. You’ll see that both of them have been declining.
The table on the chart shows that the two together – same series, two different econometric models – are almost 40% of core inflation. That’s 40% of core inflation that measures rent.
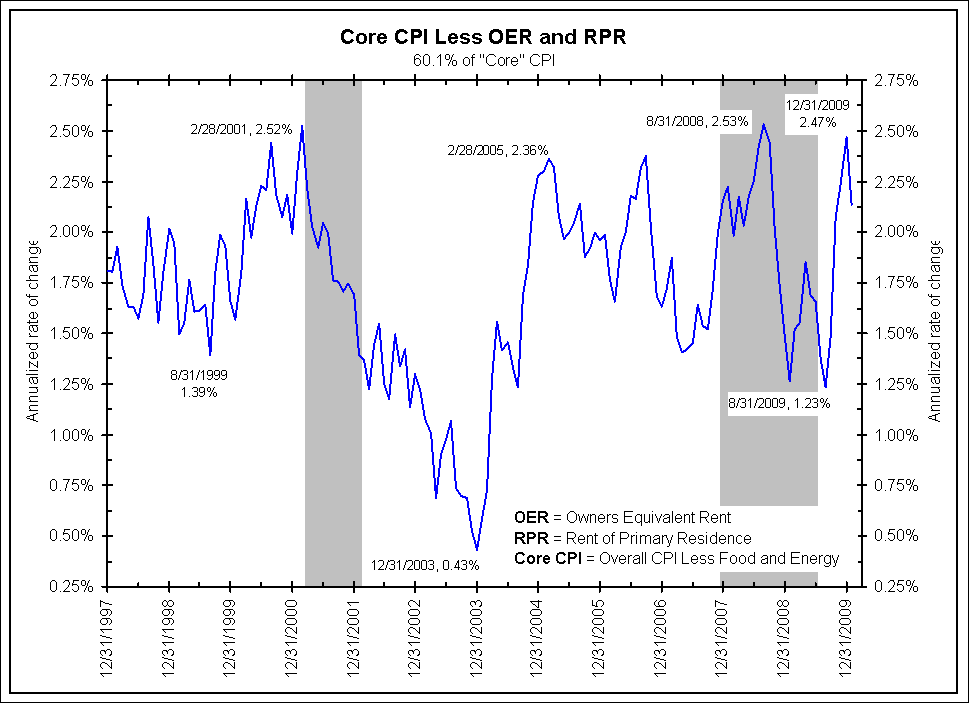
The next chart shows what happens if we take these two measures out of core CPI.
 <Click on chart for larger image>
Core CPI less less OER and RPR is running near the highs that we’ve seen in the last 12 years. As a matter of fact, December’s number – 2.47% – was just a couple of tenths off of a 12-year high in this measure.
We are not saying that this is the proper measure. Rather, we wanted to highlight that, away from rents of primary residents and away from owners’ equivalent rent, the underlying trend of core CPI is problematic for a Federal Reserve that is at 0%. And if you believe Charlie Evans as he spoke at the NABE Conference last week and has made some headlines, they are going to stay at 0% for many, many more months.
Core inflation of 2.5% is not a big deal unless the funds rate is at 0%, with a $1 trillion of excess reserves. Then we believe it becomes problematic for the Federal Reserve should these numbers stay very high.
Now this is going to get no play in the marketplace unless or until the core measures of CPI start moving higher overall. Now, how do core measures of CPI start moving higher? That’s if OER and RPR bottom out, and that big decline that we saw with them stops going down.
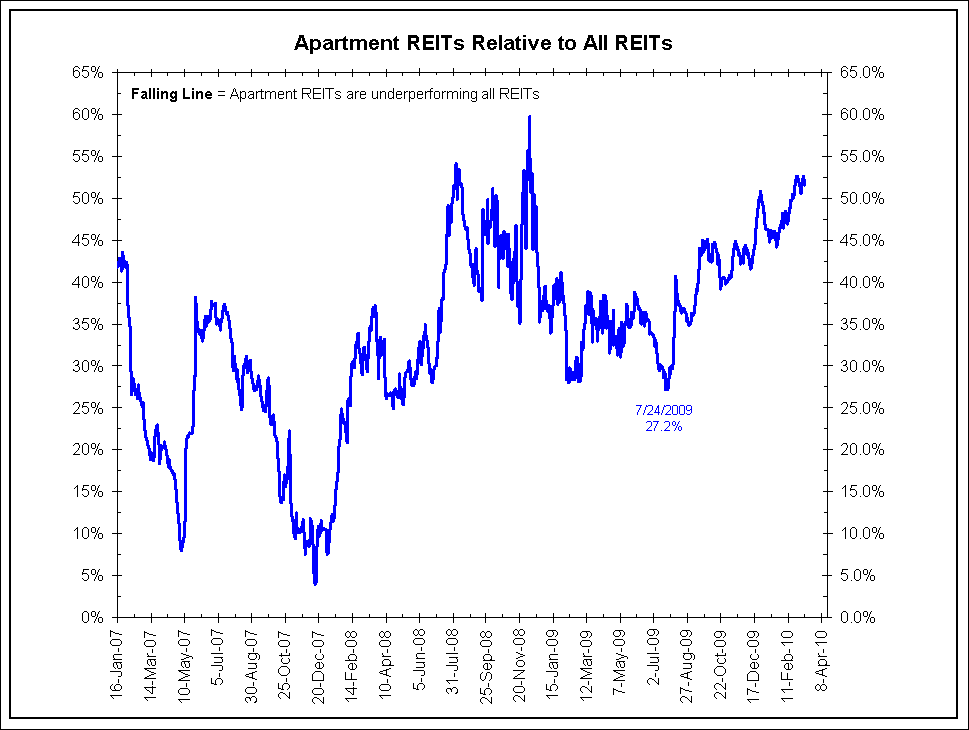
Apartment REITs Outperforming
The next chart is something that we’ve talked about for a number of years – it shows apartment REITs relative to all REITs. Apartment REITs bottomed on July 24, as we mark on the chart. The scale on the chart is the Bloomberg Apartment REIT Index relative to the Bloomberg overall REIT index. We highlighted this in a report in January.
 <Click on chart for larger image>
Since July, we have seen a general up-trend in the chart above. This means that apartment REITs have been outperforming all REITs. Apartment REITs have been doing better as rents have been collapsing. We believe this suggests that the marketplace sees maybe an end to this collapse in rentals coming soon.
We have shown in reports of the past that the lead-time on this is around six months. That is, rents turn about six month after REIT relative performance turns. That is right now, suggesting we could see a turnaround anytime in actual rents.
What has been holding down the core inflation index is that 40% of that index is collapsing. Maybe we’re starting to see this about to turn with the First-Time Homebuyers Tax Credit due to expire April 30 and the relative outperformance of apartment REITS starting about six months ago. If we see a bottoming of that 40% of core inflation, coupled with the “sticky” core less measure, we would expect a snapback in core inflation coming up in the next several months.
Should core inflation bounce back to 2.5% or 3%. That’s not necessarily, by itself, a terrible number. But if it is problematic for a Federal Reserve wants to stay at 0% and wants to be very slow and very deliberate with their exit strategy. The Federal Reserve’s strategy only works if inflation remains behaved.