Summary
Comment
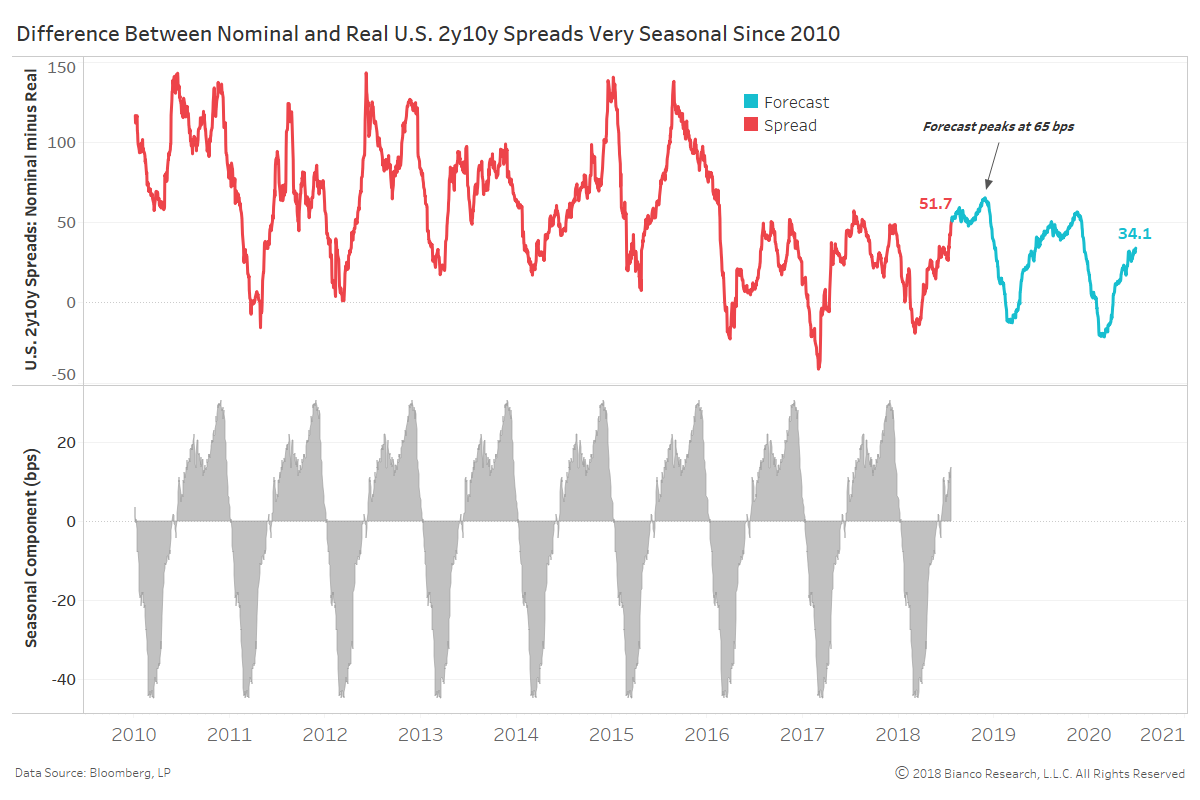
The gap between the U.S. nominal and real curves (top panel) abides by a consistent seasonal pattern (bottom panel). We use STL decomposition to extract the seasonal competent to the spread since 2010, as well as produce a forecast for the next two years (blue line).
Nominal and real curves will struggle to diverge going into year-end with their gap expected to peak at 65 bps. In other words, the real 2-year 10-year spread is likely to steepen relative to the nominal.
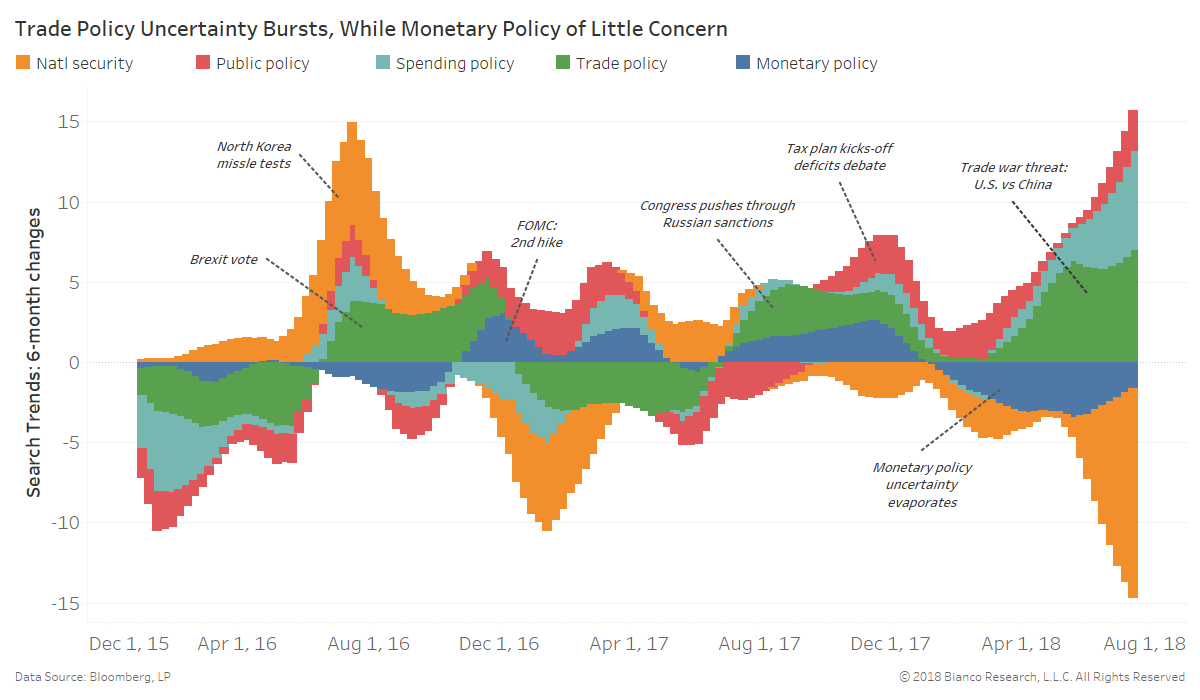
The next chart shows Google search trends for policy uncertainty ranging from national security to monetary policy. Trade (green) and spending (cyan) policy uncertainty have burst higher in 2018, while monetary policy uncertainty remains ultra-low.
Rising uncertainties have the potential to harm very positive consumer and business sentiment. We have already seen capital expenditure expectations weaken in response (see here, here, and here).
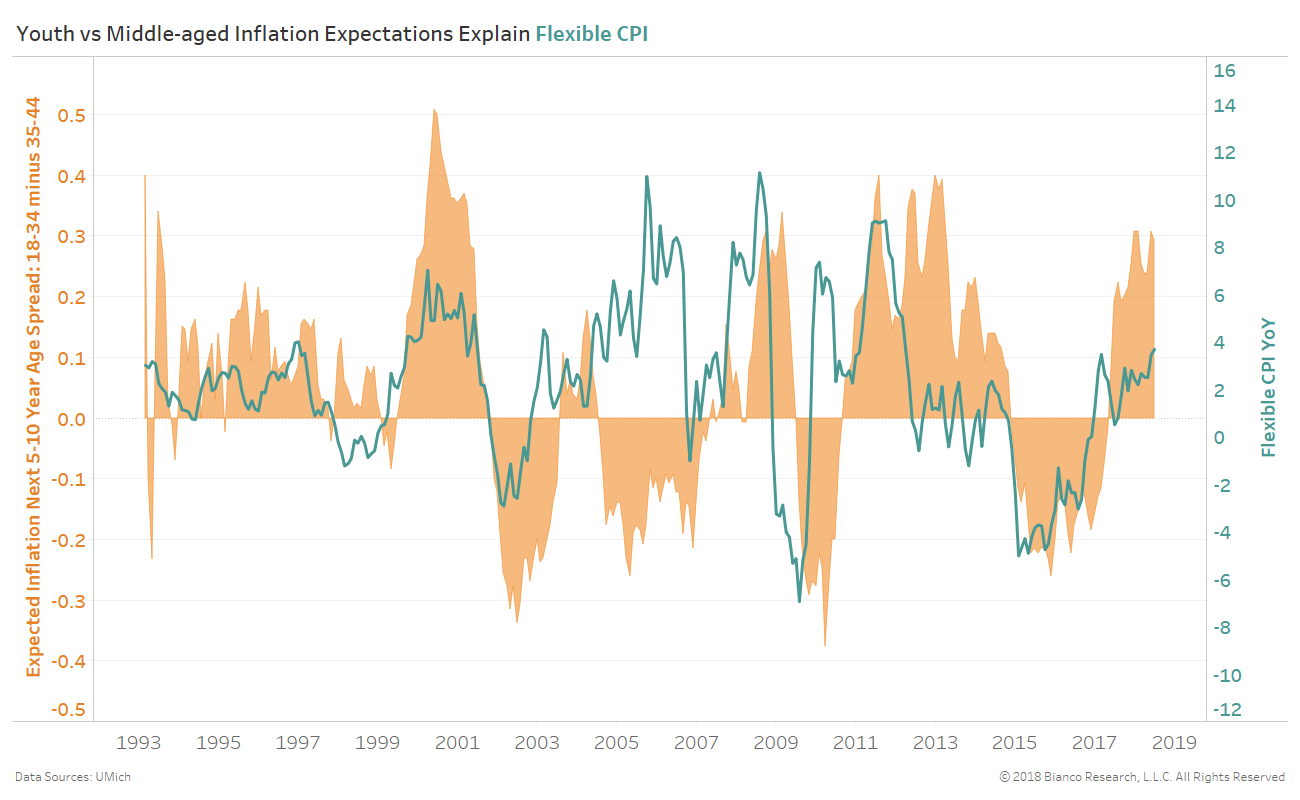
Widening gaps in the expectations for long-run (5-10 year) inflation between ages 18 to 34 and 35 to 44 years track a breakdown of CPI by the Atlanta Fed into “flexible” and “sticky” components in the chart below. The 18 to 34 age group are the most sensitive to shifting flexible prices with lower average discretionary incomes than older working ages.
‘Flexible’ CPI measures the more volatile components quickly adjusting to changing conditions like gasoline prices. Conversely, ‘sticky’ CPI measures the more stable components like administrative fees or laundromat prices.
The rise in flexible CPI is failing to achieve heights we would expect based on its relationship to this gap between young and middle-aged inflation expectations. Additionally, similar extremes in expectations have been short-lived, leading to slowing growth in flexible prices.
Weakening sentiment in the U.S. on the heels of rising policy uncertainties provide further reason for flexible price growth to subside. Remember flexible prices more greatly impact short-end real yields, meaning this would be steepening-friendly.
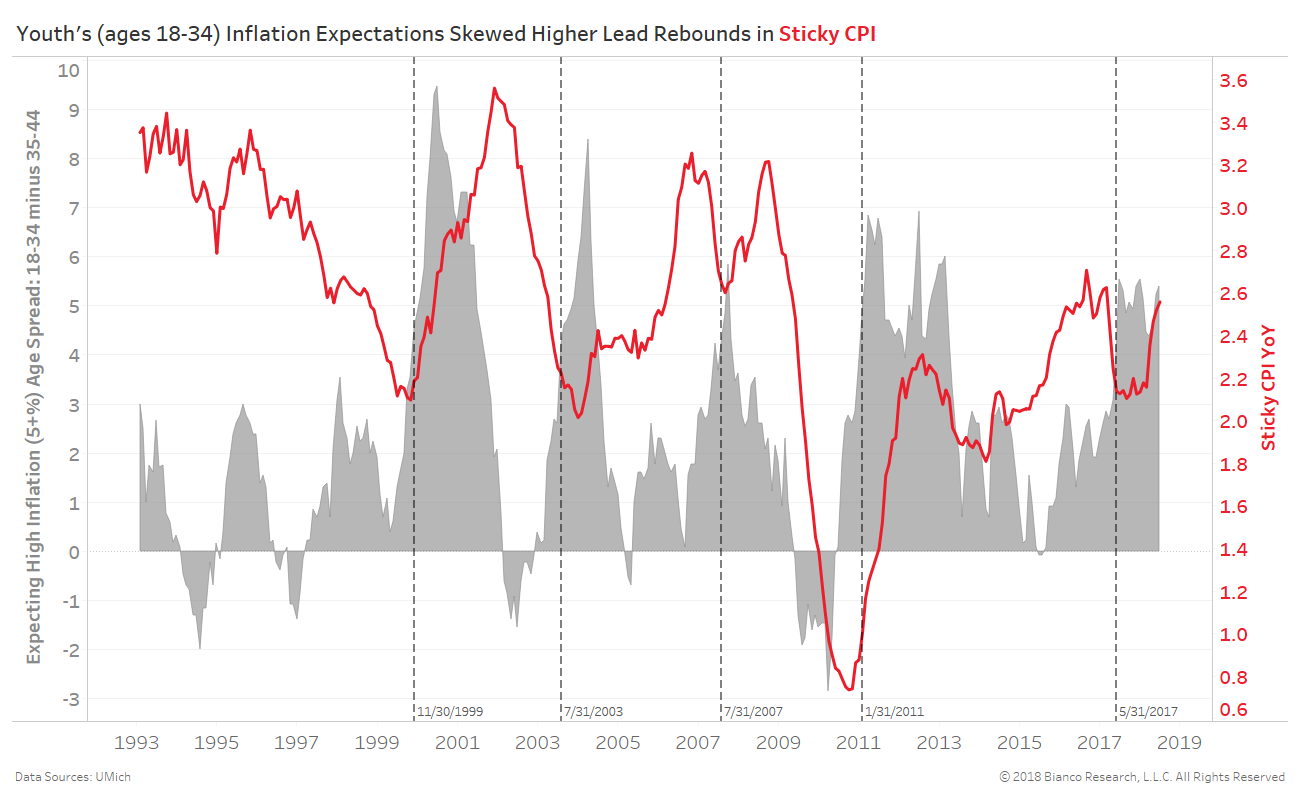
The next chart assesses the skew in inflation expectations for the next 5 to 10 years by age group. Again, we see a large gap in the percentage believing inflation will run very hot above 5% between ages 18-34 versus 35 to 44.
This gap has a knack for signaling appreciable rebounds in sticky CPI (red) over the months to follow. The vertical dotted lines mark months when blow-out inflation expectations by the 18 to 34 cohort exceeded 34 to 45 by four percent. Just like prior occasions, the cross above this threshold in May 2017 has led to a rise in sticky CPI from 2.1% to 2.6% YoY.
Strengthening sticky CPI is expected to have a greater impact on longer-end real yields, which is again steepening-friendly.
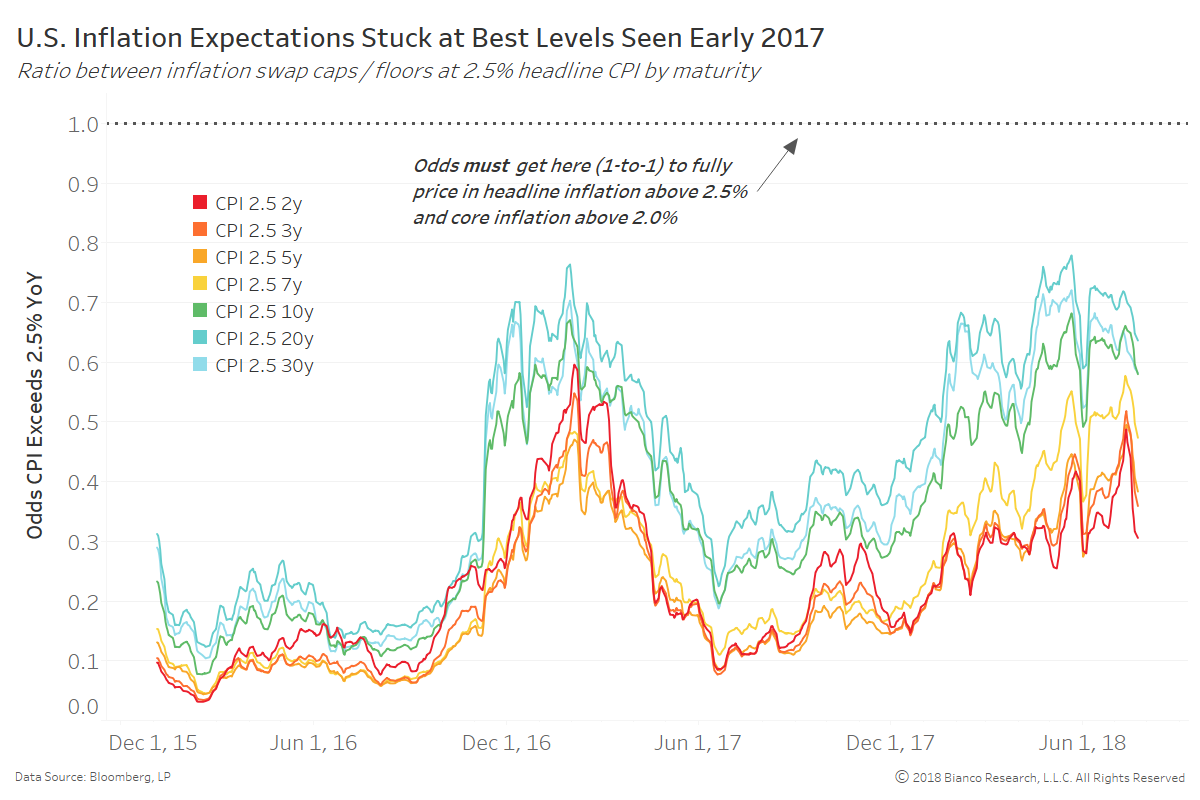
Lastly, inflation expectations measured using swap cap/floor ratios with a strike CPI of 2.5% are failing to exceed the best odds seen in early 2017. In other words, investors are not expecting headline inflation to run above 2.5% for the foreseeable future.
Rate hike expectations will remain tied to these inflation expectations. Muddling inflation expectations are not supportive of a quickened pace to tightening by the Federal Reserve.
Conclusion
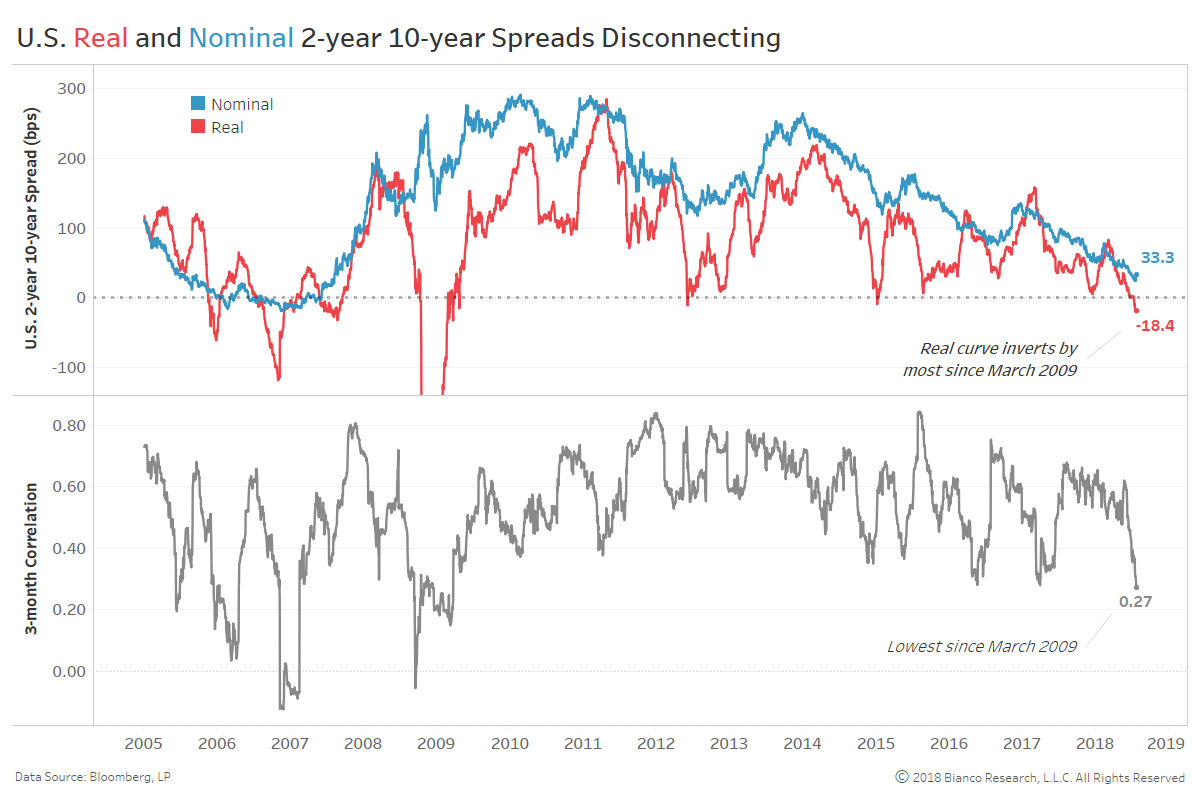
The U.S. real 2-year 10-year spread is more apt to steepen than its nominal brethren given weakening flexible prices and strengthening sticky prices. But, the nominal spread will likely grind sideways to modestly flatter in order to converge with the real spread. This implies the path to nominal curve inversion should be a slow one.
