Summary
Comment
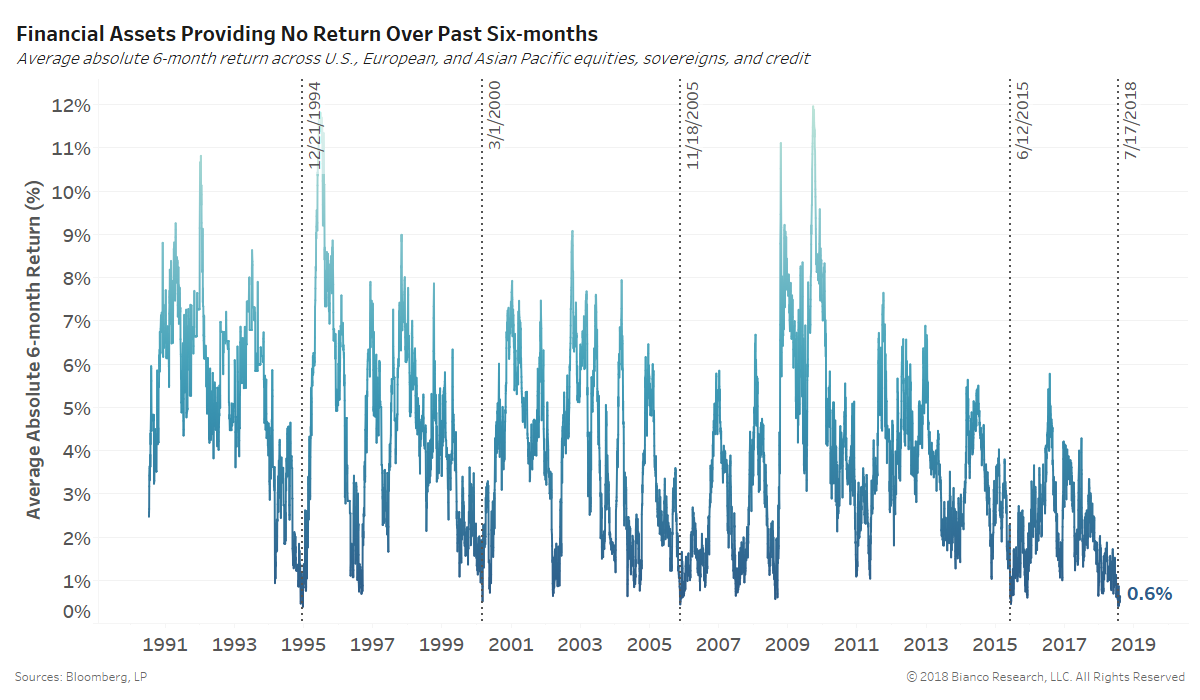
Financials across developed economies are producing their lowest average absolute returns in history back to 1990. The chart below shows the average six-month absolute return by U.S., European, and Asian Pacific equities, sovereigns, and credit falling to a paltry 0.4% in July 2018.
The three previous instances of average six-month absolute returns below 0.5% (dotted vertical lines) in December 1994, March 2000, and November 2005 have unique similarities. All three occurred toward the end of tightening cycles when economic data peaked (see CFNAI).
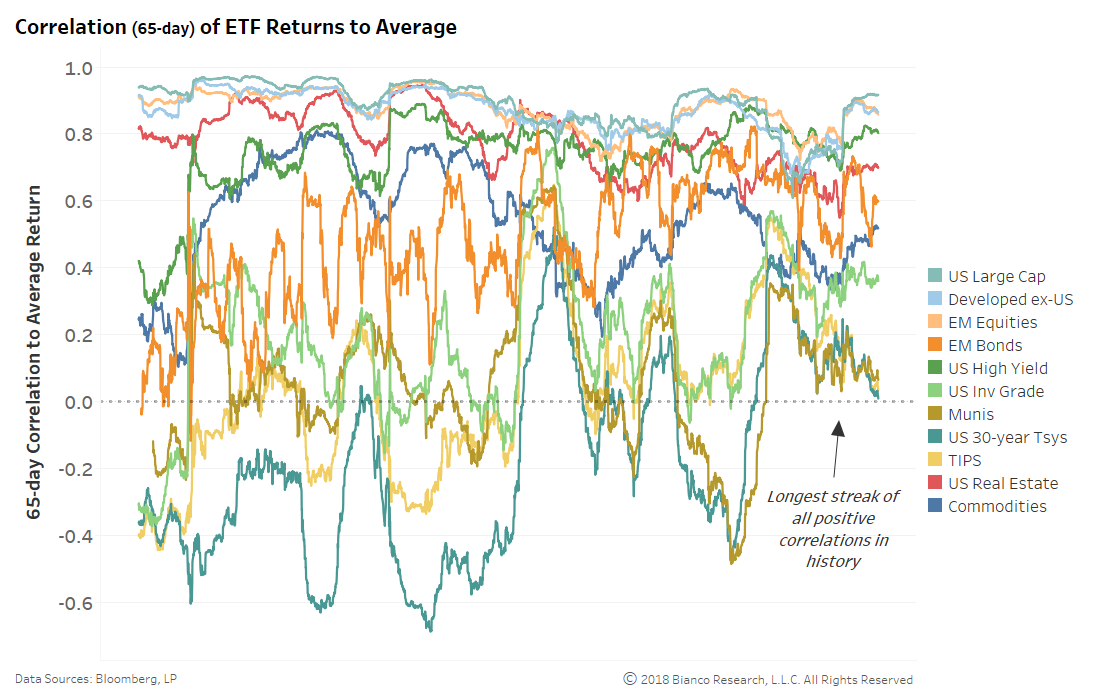
But, a growing concern of ours is the rising correlation between ALL major asset classes. The chart below shows the rolling 65-day correlation of returns by asset class to the portfolio average.
A major oddity has arisen with NOT A SINGLE asset class offering a negative correlation or buffer to the portfolio average. This period of little to no diversification opportunities has persisted since early 2016, the longest on record.
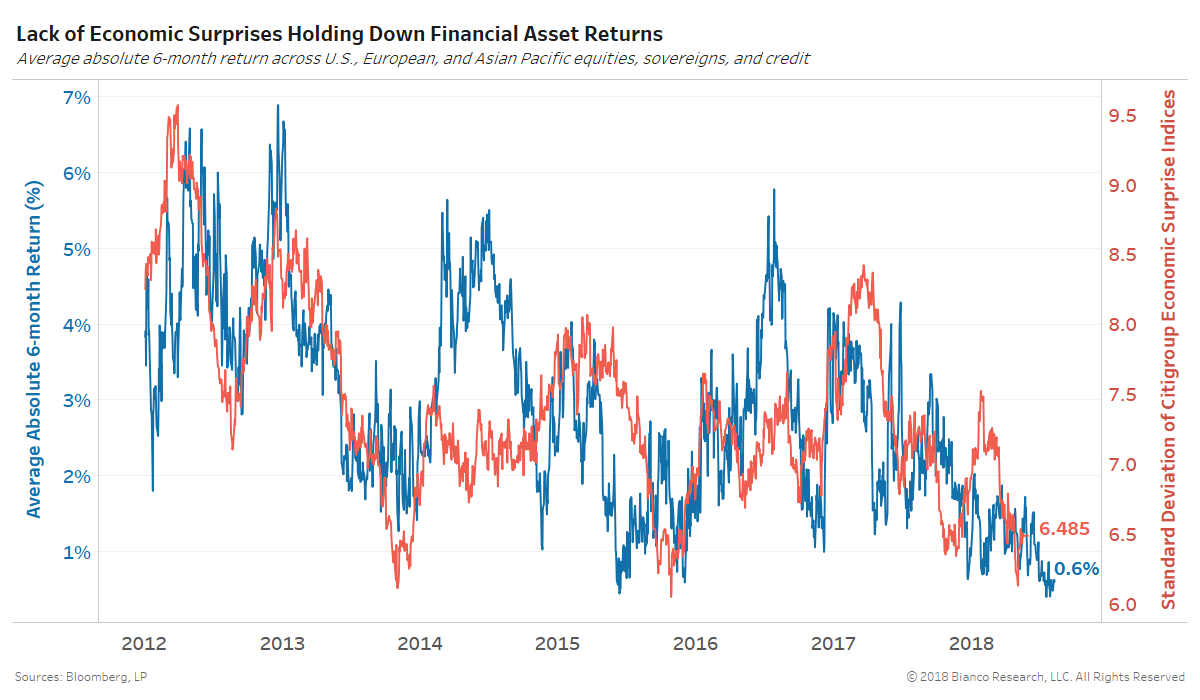
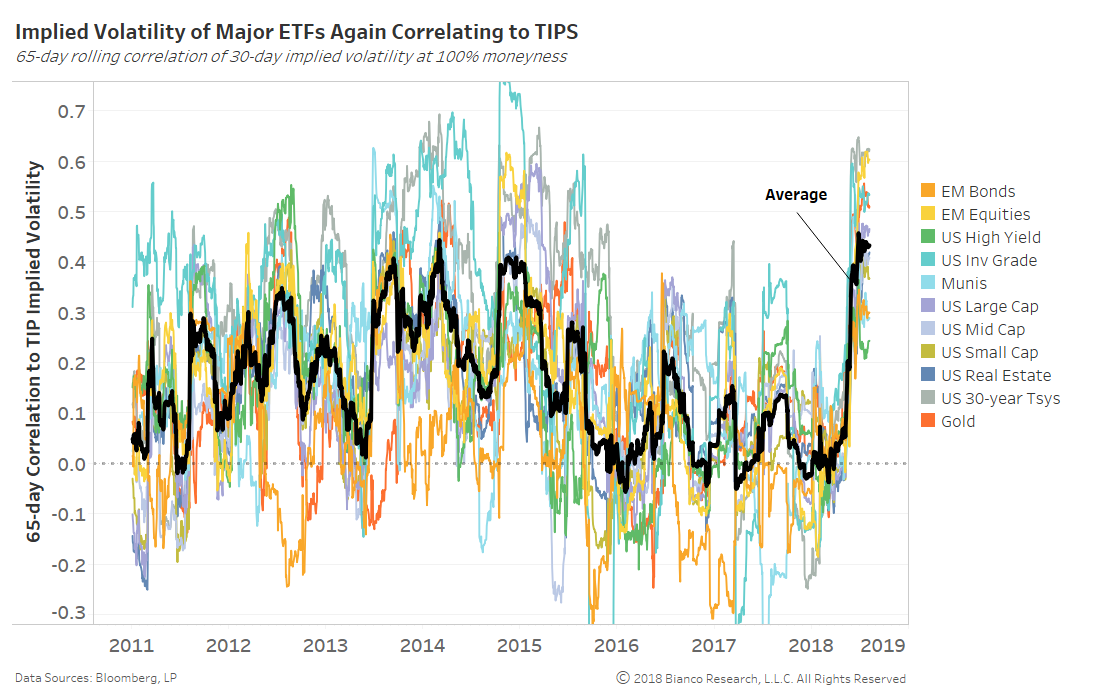
The chart below shows the rolling 65-trading day correlation between implied volatility for each asset class to U.S. Treasury inflation protection securities (TIPS). We use one-month implied volatility at 100% moneyness for major ETFs in this analysis.
Volatility or perceived risks across asset classes have swiftly aligned with U.S. TIPS (i.e. real yields) beginning early May 2018. The low volatility of asset returns has very likely been perpetuated by all-time low volatility in inflation expectations.
On the flip side, an eventual break-out of real yields and/or inflation expectations will rattle all asset classes.
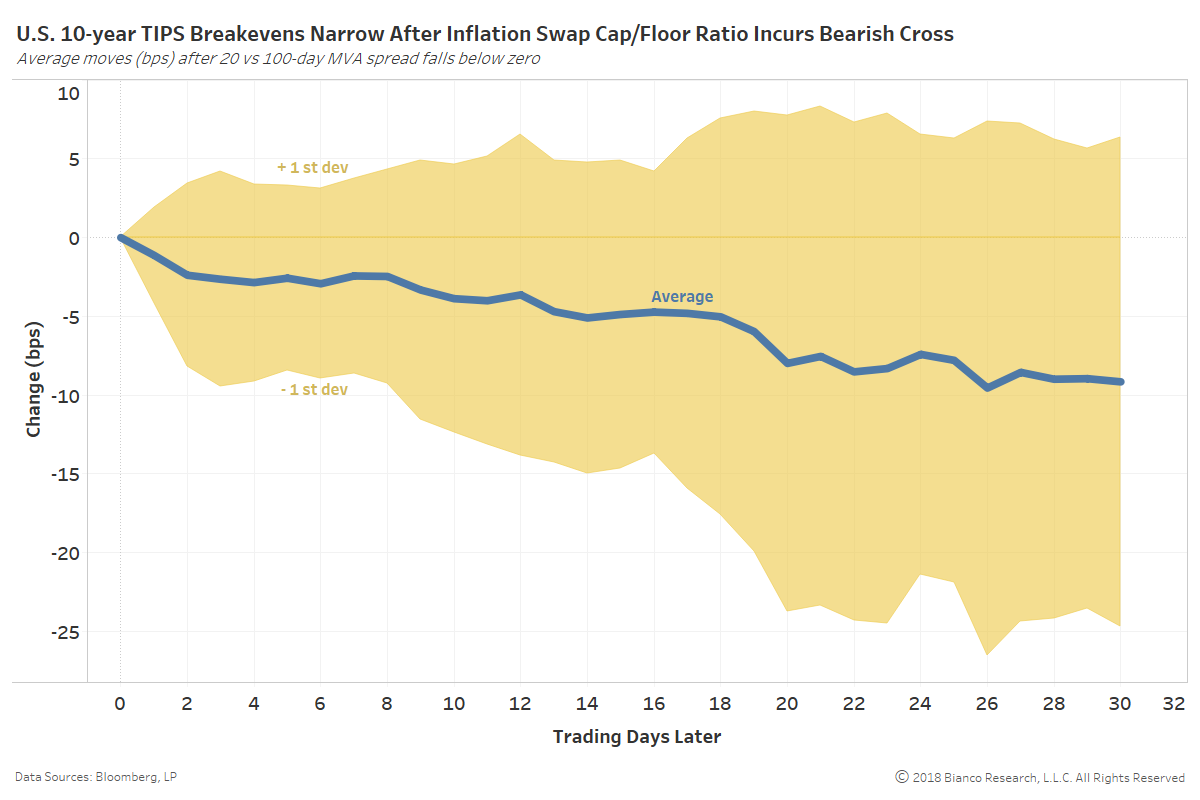
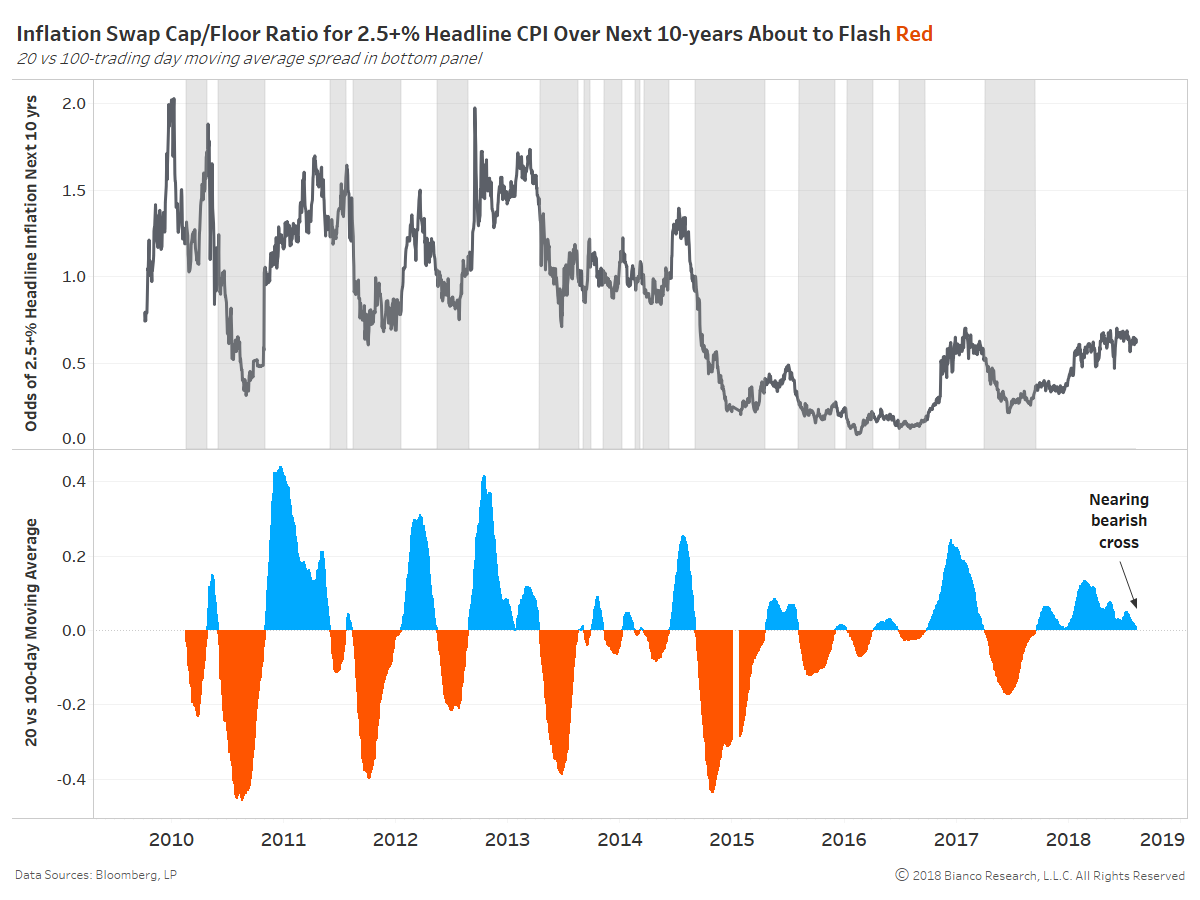
We are most closely watching the inflation swap cap/floor ratio with a strike of 2.5% headline CPI for the next 10 years (top panel). This ratio is effectively a call versus put option headline CPI will run above 2.5% for the next 10 years. Inflation swaps are less encumbered by the risk and liquidity premiums impacting TIPS breakevens.
The bottom panel in the chart below shows the spread between the 20 and 100-day moving average of the cap/floor ratio. The ratio is nearing a bearish cross for the first time since early April 2017 when TIPS breakeven went on to narrow nearly 30 bps.
The last chart shows the average (blue) and +/- one standard deviation (yellow) change in U.S. 10-year TIPS breakeven after bearish crosses. Breakevens are on average nearly 10 bps narrower over the ensuing 30 trading days.
Again, we are closely watching for a similar bearish signal for TIPS breakevens as nearly all asset classes are at least moderately aligning with the volatility of TIPS.