*** Fill out the FREE trial form at the bottom of this page to view ALL of our research ***
*** New research reports published daily ***
Summary
Comment
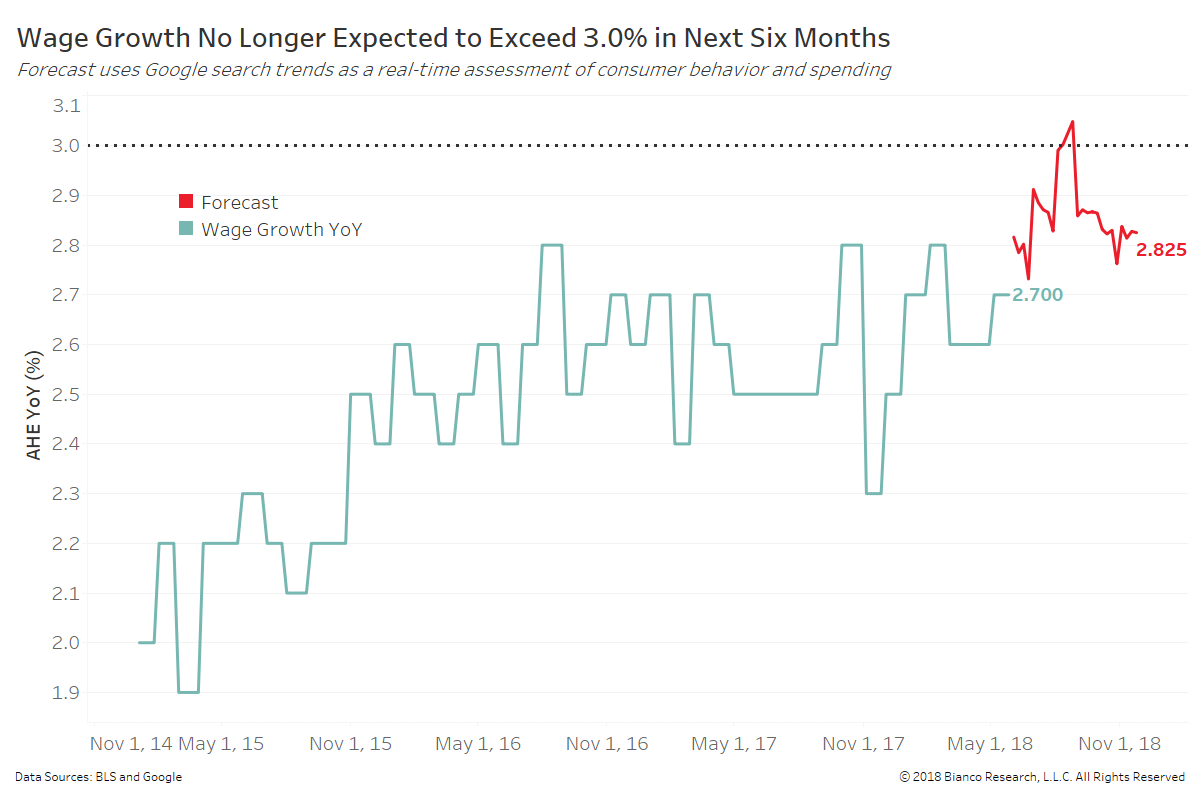
Wage growth in the U.S. has been stuck in a trading range from 2.3% to 2.8% since the summer of 2016. Recent slowing in search trends (Google) for spending and credit are signaling wage growth will remain stuck near the upper end of this range through year-end.
The chart below shows the six-month forecast for average hourly earnings (AHE) year-over-year in red at 2.83% by December 2018. We use search trends for 180 categories ranging from durables to music choices to determine the likely path of wages.
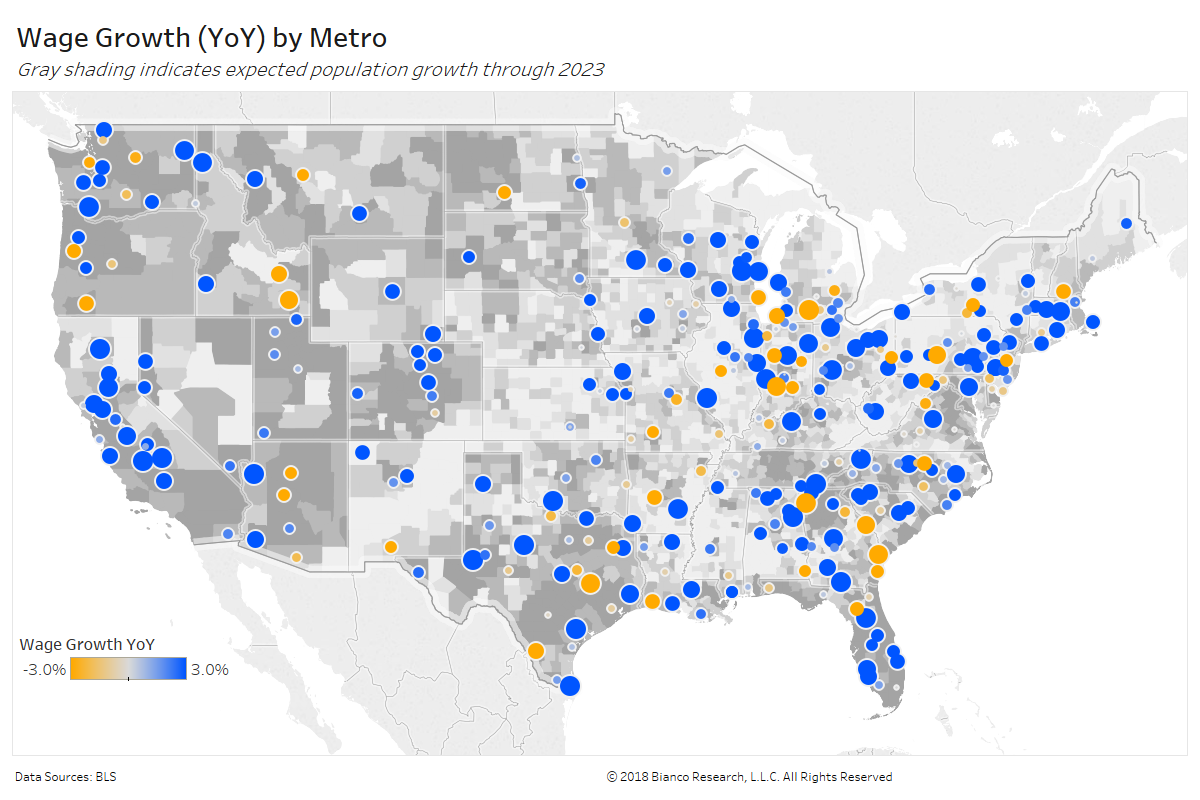
The map below shows wage growth year-over-year by metro represented as dots. Large blue dots indicate larger wage gains. The gray shading indicates expected population growth through 2023.
Many metros seeing wages losses to only modest gains reside in rural areas not expected to grow in population. Tech-heavy and energy dominant metros are more apt to see rising salaries and hourly wages.
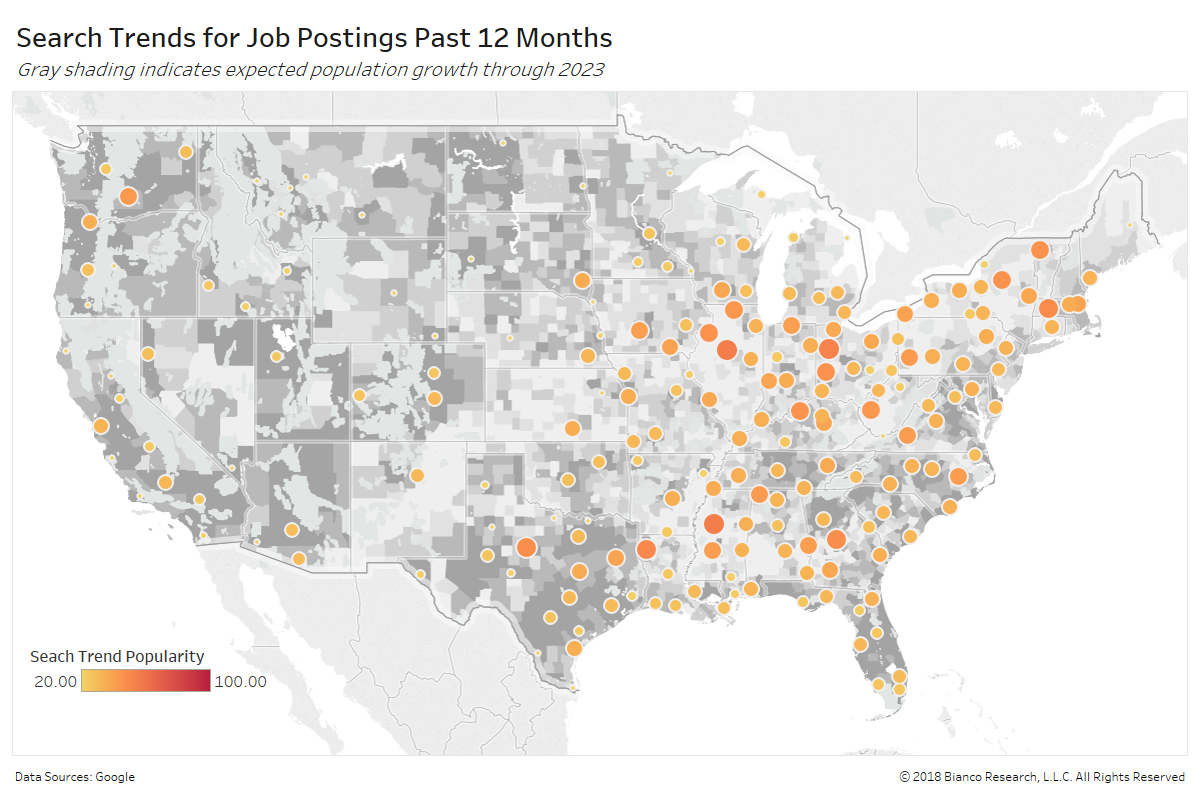
The next map shows the popularity of job postings via Google search trends. We include major websites like ‘monster.com’ and ‘careerbuilder.com,’ along with general searches about how to make job postings.
The larger orange dots indicate greater frequency of postings, which appear more prevalent in areas of stagnant to diminishing populations.
The NFIB’s survey reveals 23% of small businesses are marking ‘quality of labor’ as the single most important issue. The all-time high was reached in May 2000 at 24%. Shifting population growth and changing needs by employers may be a major reason for depressed wage growth.


