Summary
Comment
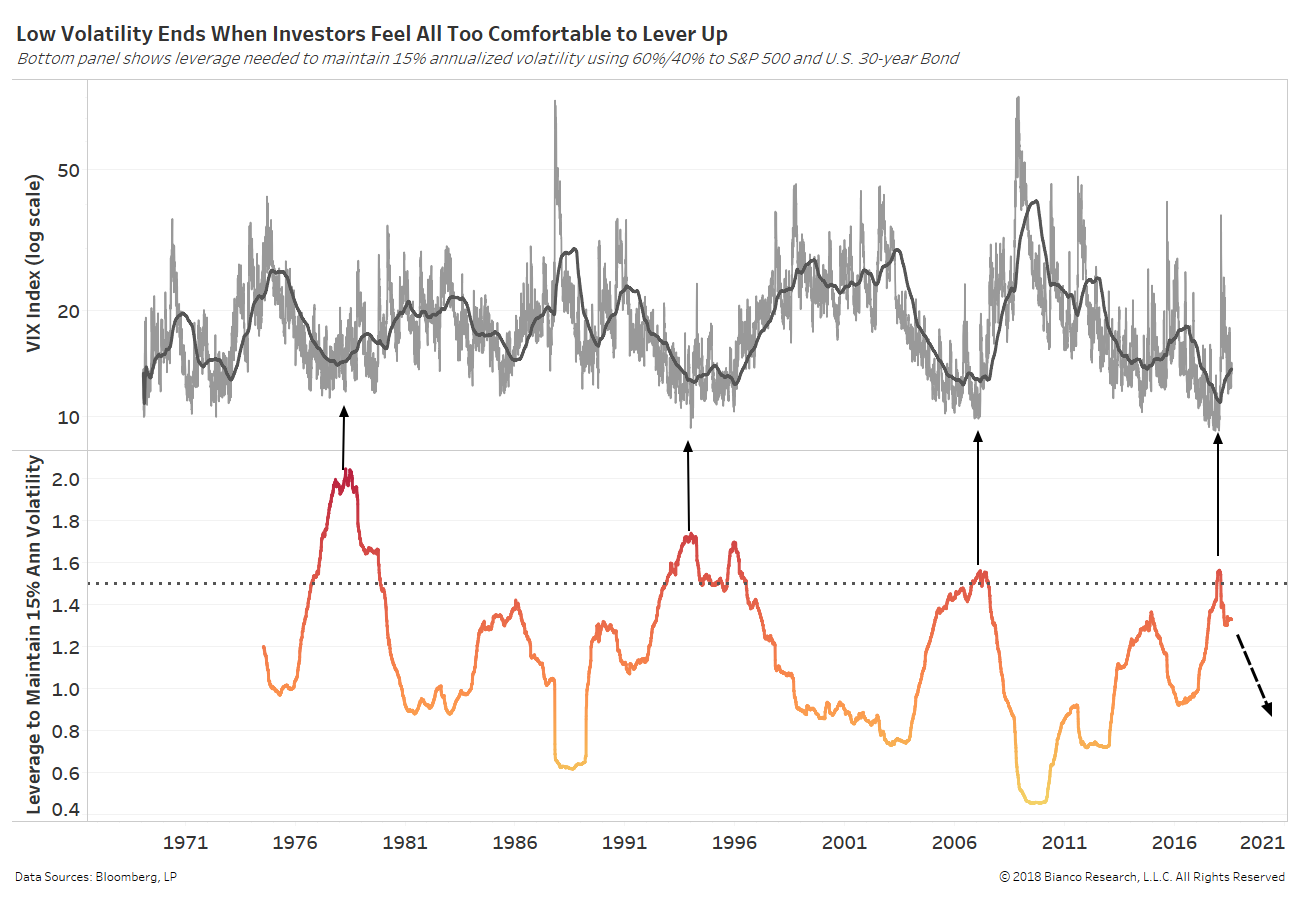
The chart below shows the many waves of implied volatility produced by the S&P 500, also known as the VIX, since 1970. A balanced portfolio of 60% equities and 40% U.S. Treasuries produces an average annualized volatility of 15% over this same time period.
Periods of well-below average volatility have instigated greater risk-taking and leverage by investors like witnessed ahead of the great financial crisis in 2007. However periods when investors become comfortable ‘levering up’ have offered contrarian signals of impending volatility and drawdowns.
The bottom panel below shows this leverage ratio needed to maintain an average annualized volatility of 15% by a balanced portfolio. Historically, regime shifts to rising volatility occur when this leverage ratio exceeds 1.5-to-1, which just occurred in mid-December 2017. Extreme comfortability in a low volatility, low inflation environment cannot last forever. Based on this metric, investors should be changing their behavior in anticipation of heightening risks.
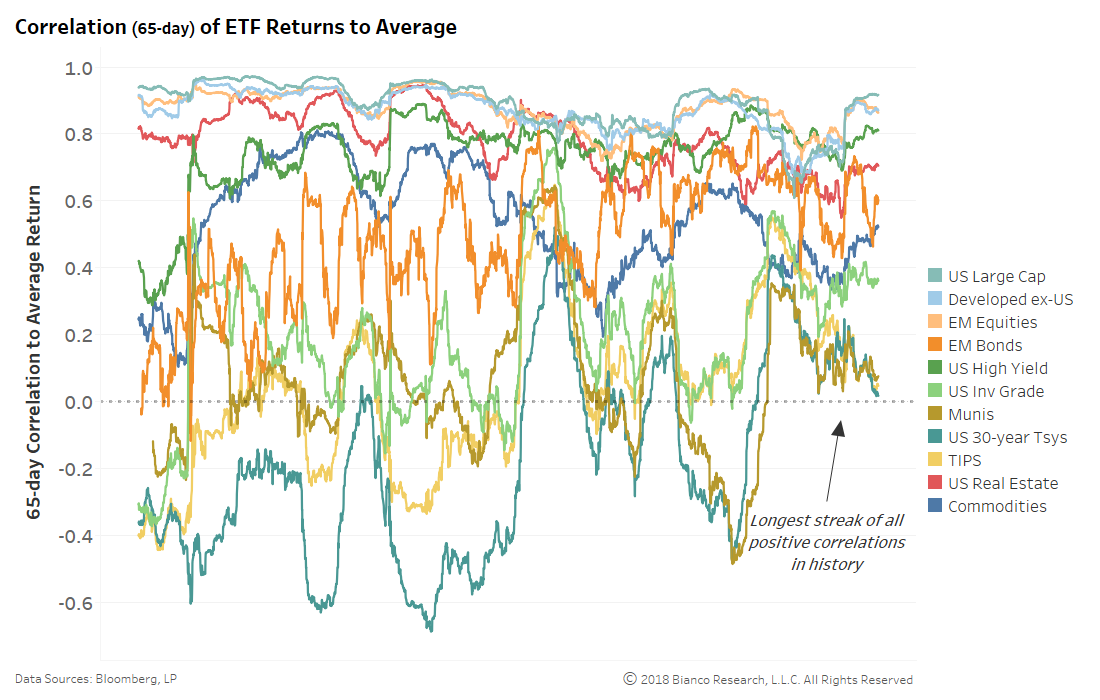
The rise of automated investment plans like those offered by robo-advisors sell the benefit of seamless diversification. But, the positive correlation of nearly all asset classes since 2016 throws a big, rusty wrench into this thesis.
The chart below shows the rolling three-month correlation between the returns of each asset class and a portfolio average. Gone are the days of long-term U.S. Treasuries, TIPS, or municipal bonds providing a hedge or negative correlation to the returns of the equity market. Higher asset correlations means little place to hide during market tumult or volatility.
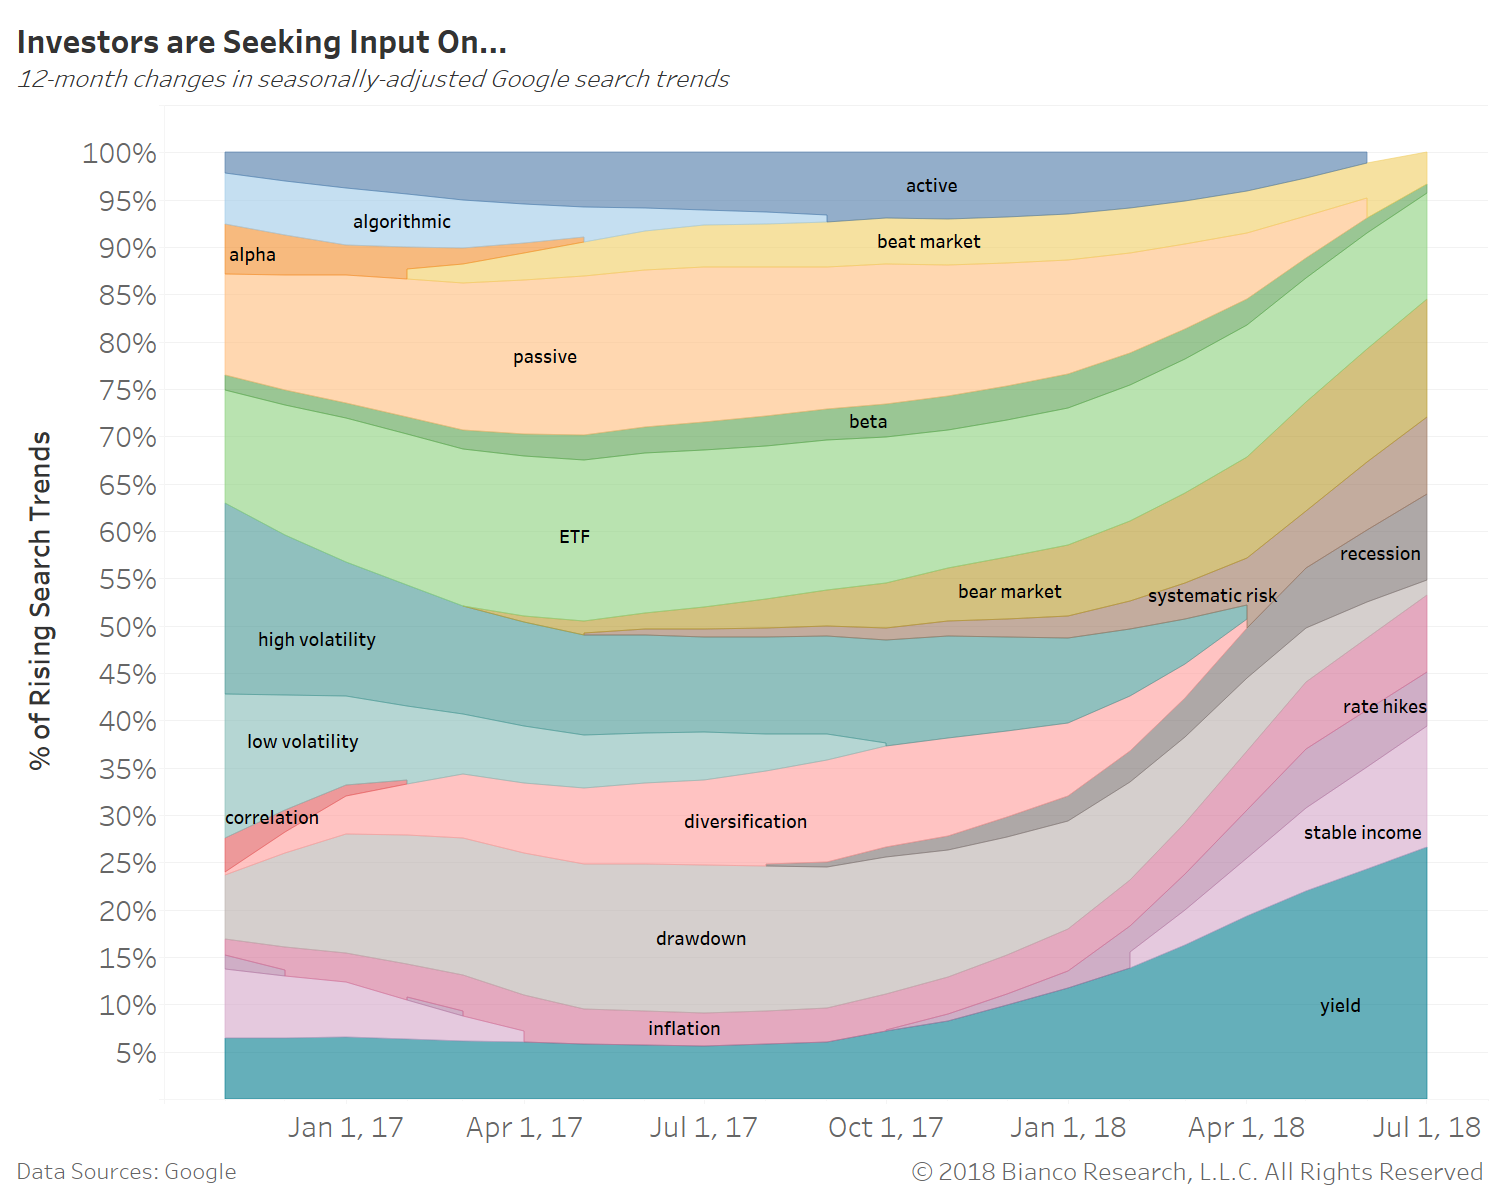
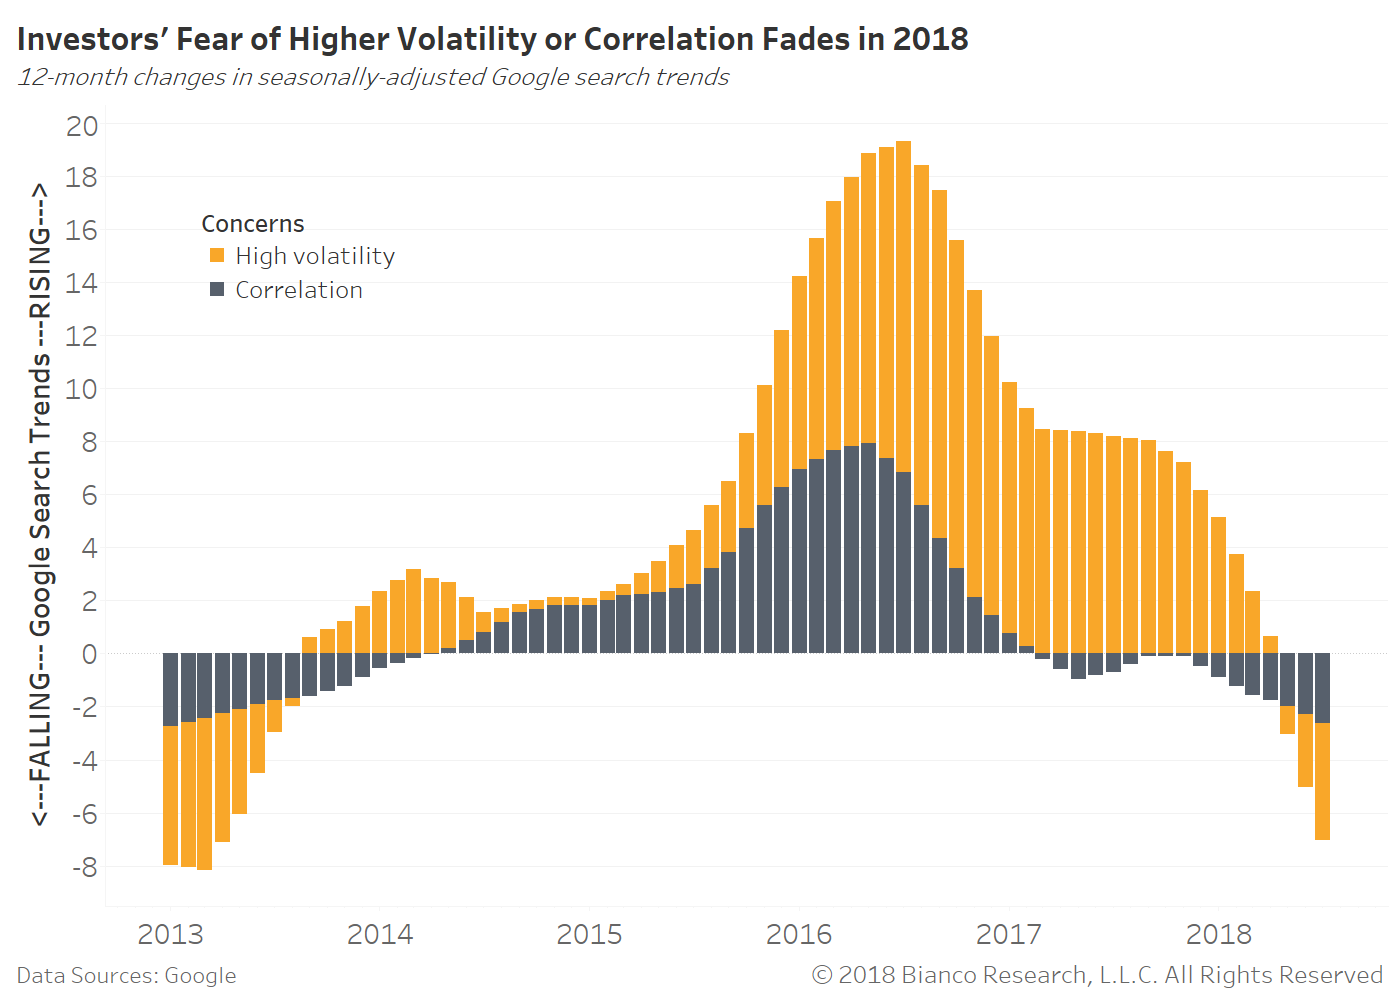
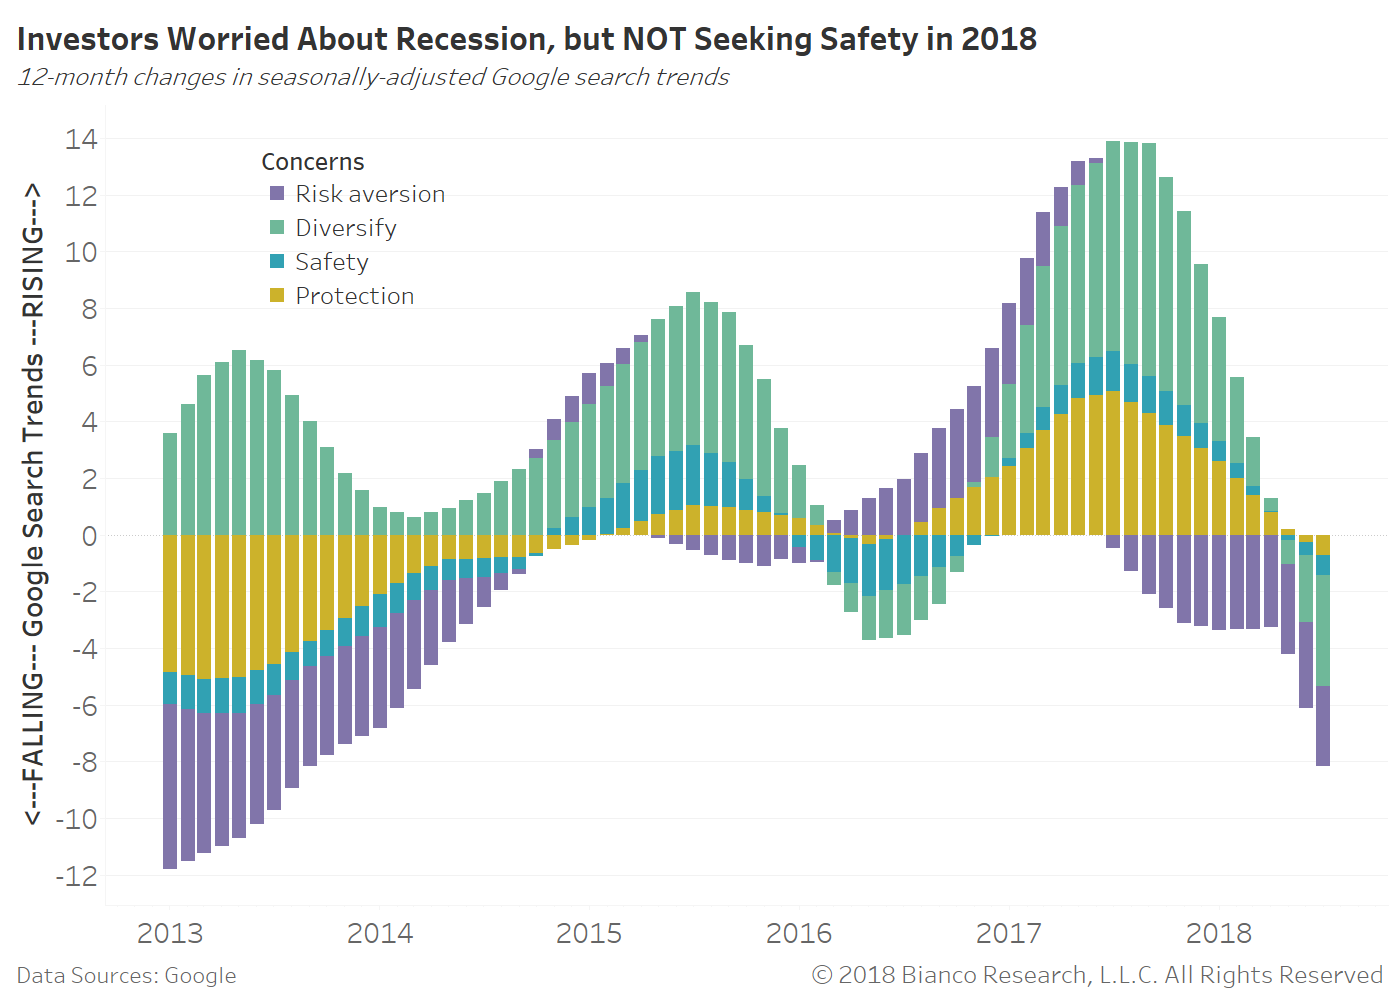
We get a real-time transparent perspective into the minds of investors by tracking their finance and investing related searches on Google. The chart below shows the share of rising search trends since the election in November 2016. Wider areas represent greater search frequencies.
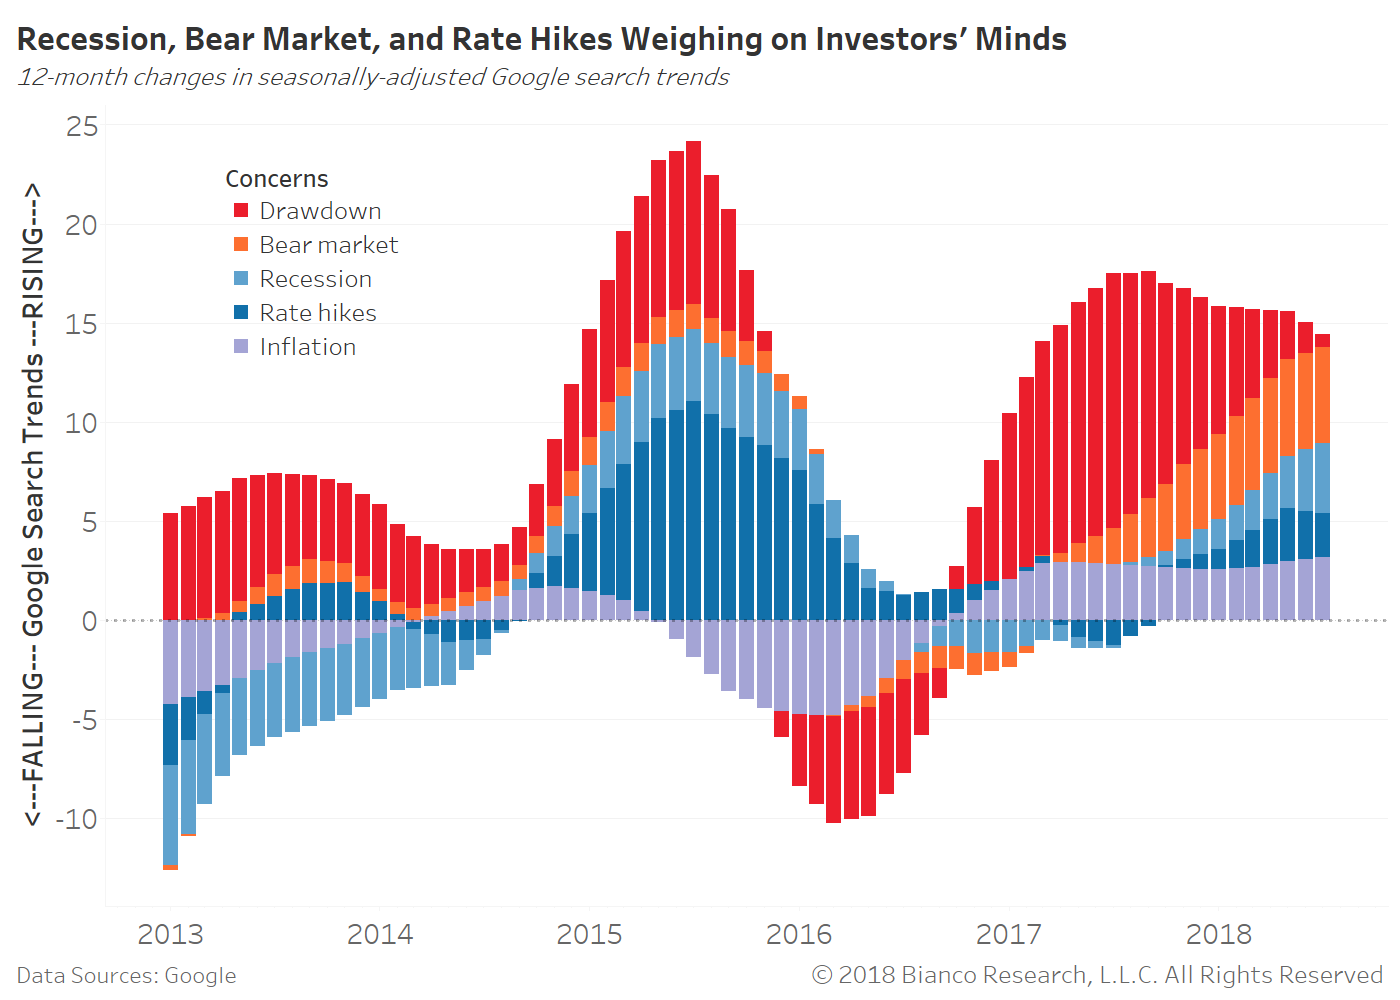
Not surprisingly, investors are growing increasingly concerned about a recession or bear market, while oddly seeking little input on volatility or asset correlation concerns. This cognitive dissonance has been fostered by an extremely prolonged period of low volatility and heavy-handed central bank intervention.
Additionally, investors are reaching out for information on rising yields found in money market accounts and other short-term fixed income investments. The lure of cash and/or cash-equivalents is growing.
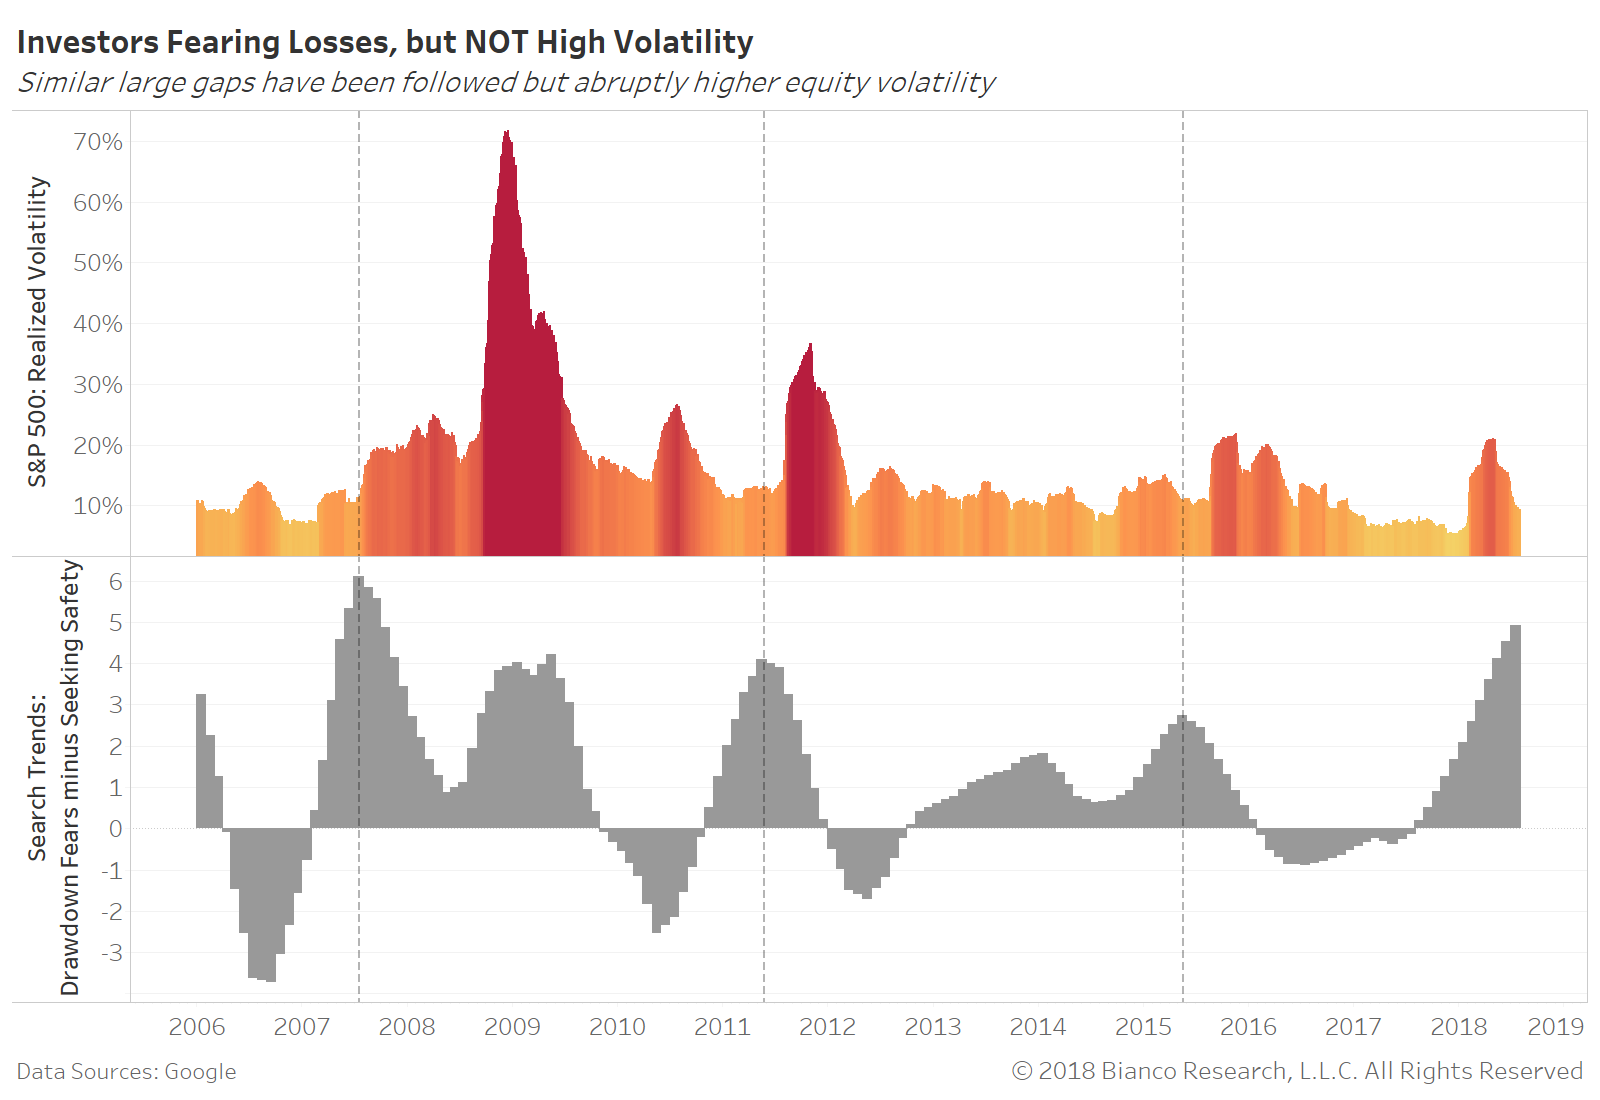
Unfortunately, investors have a tendency of becoming too comfortable at the wrong time. The bottom panel in the chart below spreads search trends for drawdown/recession versus risk aversion/diversification. These are the same search trends shown in the charts above. This spread measures the gap between fear of losses and a need to seek safety/diversification.
The S&P 500’s realized volatility has historically jumped in the months after this spread materially widens. For example, peaks in July 2007, May 2011, and May 2015 saw realized volatility more than double within the following six months.
How do we diminish the risk of heightened asset correlations? We allocate to investments offering a restrictive cap to volatility, like target volatility strategies.
Many of these strategies offer multi-asset portfolios weighted by correlation and/or volatility, but also caps on permissible daily volatility. For example, a strategy may shift assets to increasingly-yielding money market funds to diminish exposure or leverage when day-to-day volatility exceeds a pre-determined percentage like 6%.
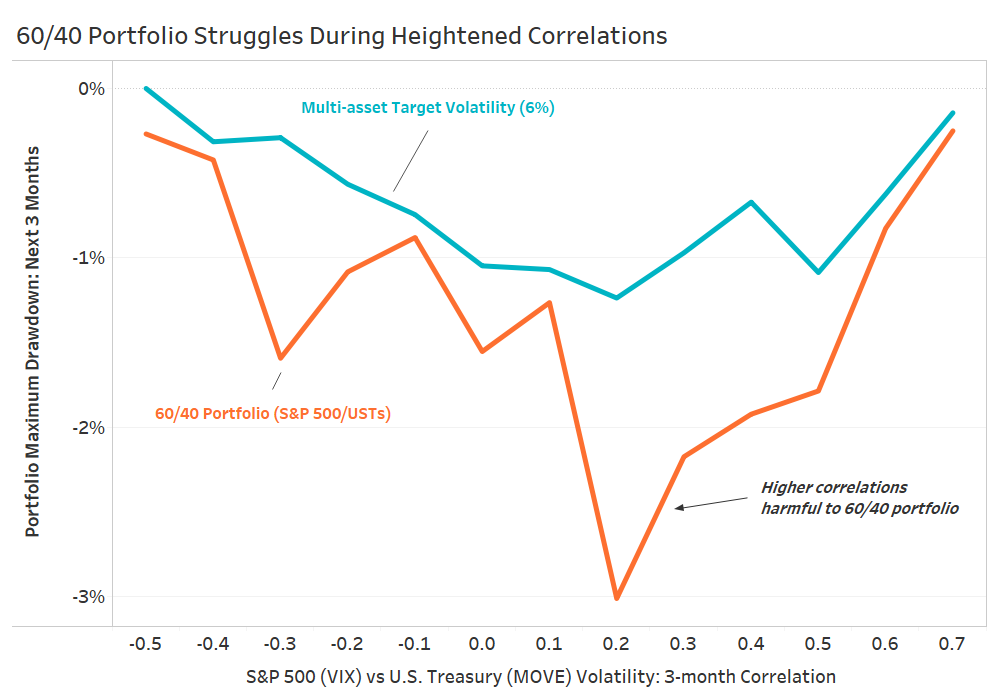
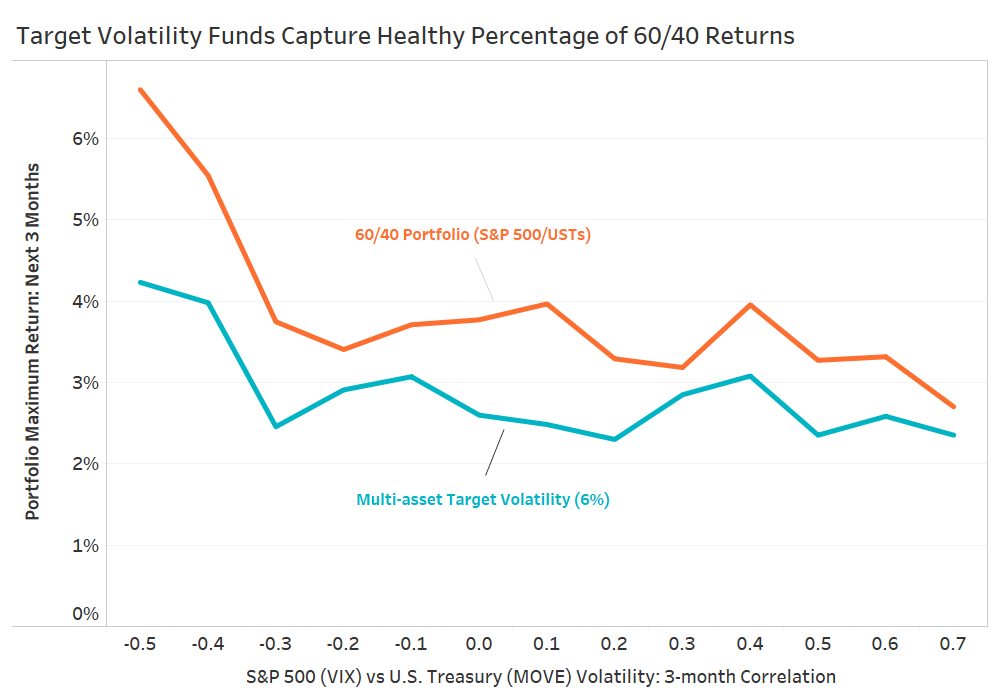
The analysis below highlights why investors should care about increasing correlation between risk and safe assets. The chart shows statistics for a traditional 60/40 portfolio (orange) and composite of multi-asset strategies with target volatility of 5 to 6% (blue). The x-axis indicates the rolling three-month correlation between implied volatility of S&P 500 (VIX) and U.S. Treasuries (MOVE).
The first chart shows the maximum drawdown incurred by each strategy over the ensuing three months. The 60/40 portfolio is subject to substantially larger drawdowns after correlation between volatility of the S&P 500 and U.S. Treasuries increases.
The second chart shows the maximum return produced by each strategy over the ensuing three months. The target volatility strategies are able to keep nearly 75% of the gains without incurring sizable drawdowns. You can not have your cake and eat it too. Nonetheless, buffering for unexpected volatility within an investment plan has become a very unconsidered need by investors.
The era of central bank stimulus will soon be behind us, replaced by traditional business cycles and rising concerns about inflation. The rising correlation among asset classes is typical, but a distant memory, during periods of upward trending inflation.

