- Conseulo Mack’s WealthTrack – Interview with Jim Grant
On this week’s Consuelo Mack WealthTrack, Financial Thought Leader James Grant explains why he believes the Federal Reserve’s easy money policies will wreak havoc on the economy and markets. The dangers of inflation creep and how to protect yourself against it are the focus of this week’s Consuelo Mack WealthTrack.
<Click in graphic for larger image>
- The Wall Street Journal – Mark Whitehouse and Jon Hilsenrath: Underlying Inflation Remains Tame
At the same time, two indicators that Federal Reserve officials watch closely to gauge underlying trends suggested inflation pressures remain subdued. Prices excluding food and energy rose only 0.1% from February and 1.2% from a year earlier. Also, consumers’ concerns about long-term inflation eased despite rising energy prices: Inflation expectations for the next five to ten years declined to 2.9% in early April, down from 3.2% in March, according to a Reuters/University of Michigan survey. “This is going to be a relief for the Fed,” says Michelle Meyer, senior U.S. economist at Bank of America Merrill Lynch in New York. “It gives them room to keep rates low to support the recovery.”
Comment
<Click on chart for larger image>
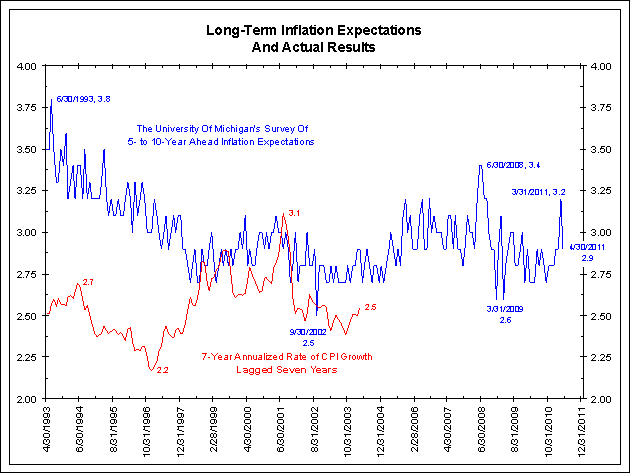
To put it bluntly, this survey is a poor predictor of future inflation. This was confirmed by a New York Federal Reserve study in 2008. This is why we prefer to use the Tips market as a forecast of expected inflation.
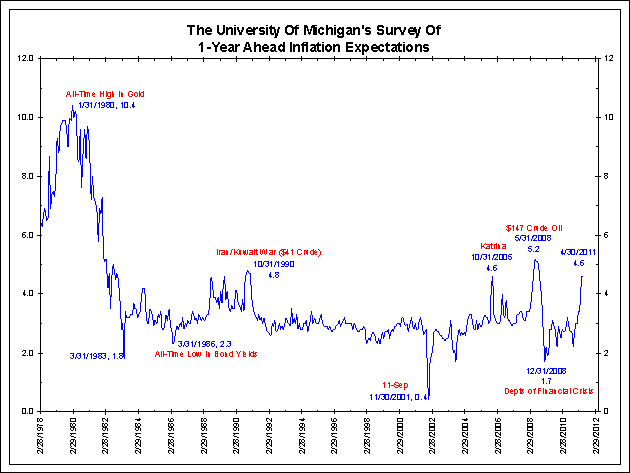
If the New York Federal Reserve itself wrote about this survey’s shortcomings, why is it now being highlighted? As the next two charts show, the University of Michigan’s 1-year expected inflation survey and the 10-year Tips inflation breakeven rate both show building inflation expectations. So, given multiple inflation expectation measures, expect the Federal Reserve to jump from indicator to indicator and highlight whatever shows inflation to be most behaved. This has long been their behavior, dating back to the Greenspan days, and it continues today.
<Click on chart for larger image>
<Click on chart for larger image>
Have “Second Order” Inflation Effects Arrived?
The second contention above is the March inflation report shows that core inflation remains well-behaved. In our latest Inflation Watch titled, ?”Have The Second Order Inflation Effects Arrived?” we disagreed with this idea:
Long-time readers know that we see inflation as both a concept, which was best described last week in Inflation Is A State Of Mind and a measurement.
Regarding the measurement of inflation, we differ with the crowd that believes wages are the critical component. Instead, we argue that housing measures are more important. Wages are partially conceptual whereas housing is the most important statistic in the measurement of inflation.
We also hold a different viewpoint on inflation from the Federal Reserve. We believe headline inflation is the better measure, while they prefer core inflation. We discussed our opinion on the matter in last Month’s Inflation Watch. Here we focus in the measure of core inflation.
As the next chart shows, year-over-year (YoY) core inflation (blue line) has rebounded from 0.6% last October to 1.2% as of March 31, 2011. The three-month annualized rate of inflation (red line) has been running just over 2%, the upper-end of what is believed to be the Federal Reserve’s preferred range (1% to 2%).
<Click on chart for larger image>
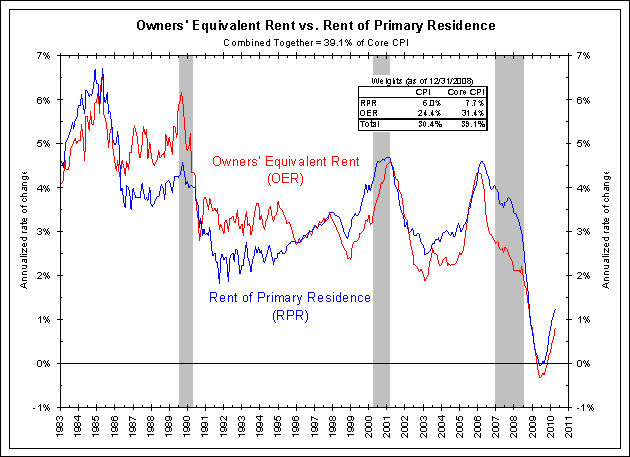
As the next chart shows, Owners’ Equivalent Rent (OER) and Rents of Primary Residence (RPR) have been on the rise. Combined, these measures account for approximately 40% of core inflation. OER is the main measure of housing inflation whereas RPR is the main measure of renters’ inflation. Both are derived from the same survey of rents conducted by the Bureau of Labor Statistics.
Although the first time homeowner’s tax credit may have artificially depressed housing inflation, it is now rebounding smartly. Over the last three months OER has risen by an annualized 1.25%, well above its 0.79% YoY rise. As predicted, renters’ inflation is also bouncing back strongly, up an annualized 1.86% over the last three months verses a rise of 1.23% YoY.
<Click on chart for larger image>
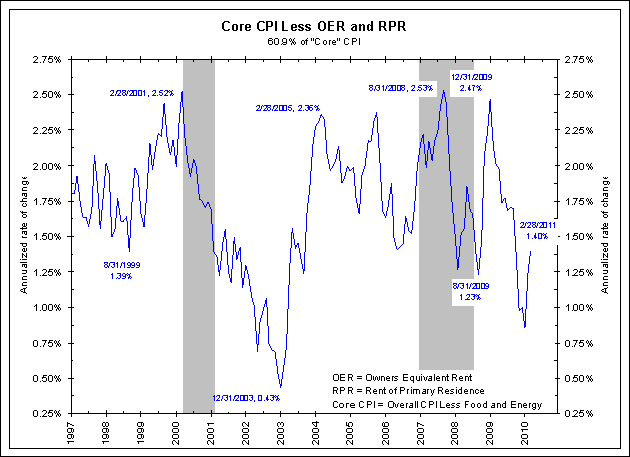
What about the other 60% of core inflation? The next chart shows core CPI less OER and RPR on both a YoY and three-month annualized basis. Non-housing parts of core inflation are rebounding as well, up 1.46% YoY and 2.49% on a three-month annualized basis.
<Click on chart for larger image>
Conclusion – Has Inflation Arrived?
The Federal Reserve dismisses the rise in commodity prices as being unrelated to monetary policy. We somewhat disagree, but will leave this discussion for another time. More to the point, the Federal Reserve states they are looking for “second order effects” of higher commodity prices being passed through as a general rise in all prices.
The measures above are consistent with the idea that these second order effects might be materializing. Three-month annualized non-housing core inflation (60% of core inflation), at 2.49%, is well above the Federal Reserve’s preferred target of 1.0% to 2.0%. Housing inflation (40% of core inflation) is finally rebounding strongly now that the first time homeowner’s tax credit has expired.
With a few more months of similar numbers we could have a real inflation “issue.”
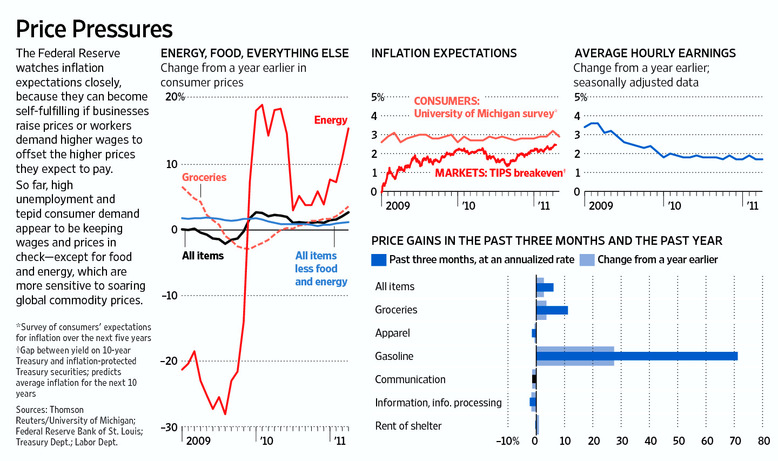


In the highlighted passage above, the Federal Reserve’s mouthpiece, Jon Hilsenrath, tells us that inflation expectations are moderating and actual inflation is under control. We have a different take.
Inflation Expectations: Pick The One That Shows No Problems
The University of Michigan Survey Research Center compiles the Reuters/University of Michigan Consumer Attitudes Survey. The center conducts phone interviews of a random sample of approximately 500 households. This is part of the more famous consumer survey of current conditions and expectations. Regarding inflation, this interview asks these households how much they expect the Consumer Price Index (CPI) to increase over the next year and over the next five to ten years. For each time horizon, the question asks respondents whether they believe “prices in general” will go up, go down, or stay where they are now. Those who respond “up” (or “down”) are then asked by about what percent they expect prices in general to go up (or down).
In the story above, the Federal Reserve is taking comfort that the results for the April survey for inflation expectations 5 to 10 years from now decreased. The last 15 years of results are shown below in blue. In red we show the 7-year annualized rate of CPI growth lagged seven years. We arbitrarily chose this measure since it is the mid-point between 5 and 10 years. In other words, the blue line shows inflation expectations from the Michigan survey 5 to 10 years in the future and the red line shows what actually happened over the next seven years.